We have added to the charts available on our Household Survey Data-set Page.
Employment-Population Ratio, Participation Rate and Unemployment Rate are charted separately and together for various age groups, gender and time-scale combination.
Below are two examples.
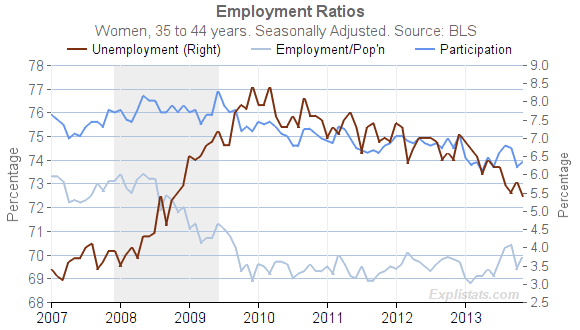
Click to enlarge
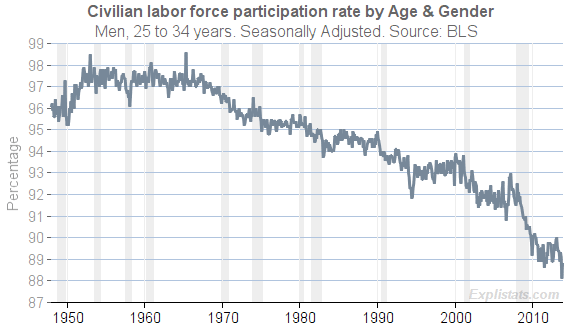
Click to enlarge