Click to enlarge
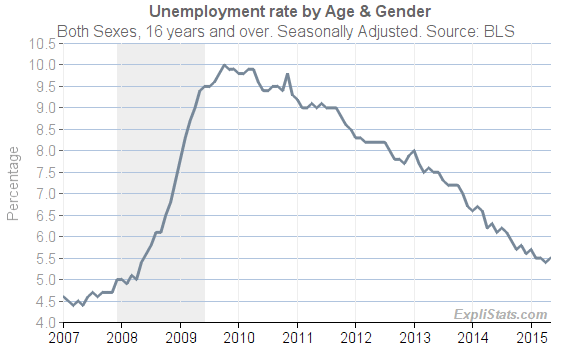
The BLS U.3 unemployment rate rose in May to 5.5% from 5.4% in April.
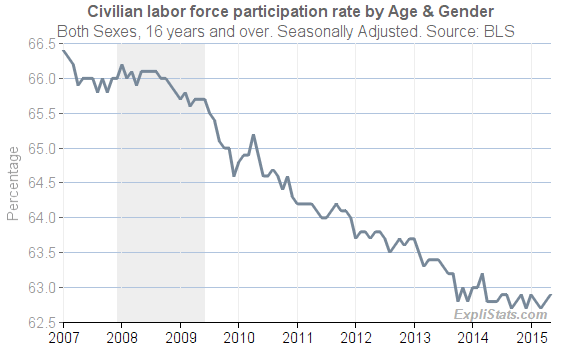
The Labor Force Participation rate rose to 62.9% from 62.8%.
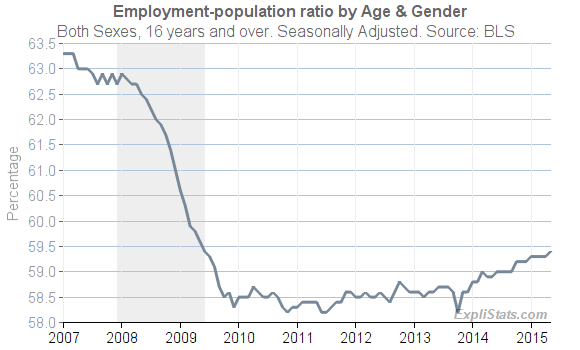
The Employment/Population Ratio rose to 59.4% from 59.3%.
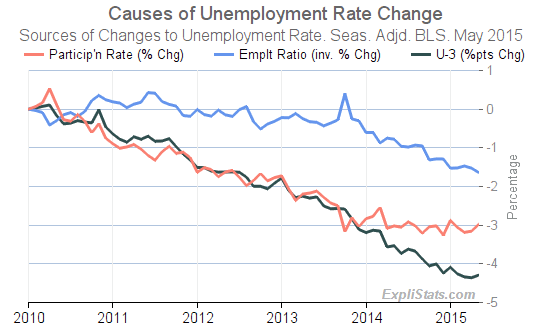
The contribution of these two factors to the Unemployment Rate is shown in the chart below.

Click to enlarge
The relationship between the three measures is as follows:
UR = (LR – ER) / LR
Where LR is the Labor Force Participation Rate, and ER is the Employment Ratio.
Note how a decrease in the participation rate on its own, reduces the unemployment rate: The number of available workers drops, and thus there are relatively fewer unemployed – even in the absence of job growth. This is what has happened in the recovery since the “Great Recession”.

Click to enlarge

Click to enlarge
More detailed Labor Force Participation Charts and Employment Ratio Charts
| U.S. Unemployment Rate. Seasonally Adjusted. | ||||||||||||
|---|---|---|---|---|---|---|---|---|---|---|---|---|
| Total | Labor Force Mlns | Rate (%) | Monthly Change (%pts) | Year/Year Change (%pts) | ||||||||
| May 2014 | May 2015 | May 2014 | Mar. 2015 | Apr. 2015 | May 2015 | Mar. 2015 | Apr. 2015 | May 2015 | Mar. 2015 | Apr. 2015 | May 2015 | |
| All Ages (16+) | 155.6 | 157.5 | 6.3 | 5.5 | 5.4 | 5.5 | 0.0 | -0.1 | 0.1 | -1.1 | -0.8 | -0.8 |
| 16 to 19 years | 5.6 | 5.8 | 19.2 | 17.5 | 17.1 | 17.9 | 0.4 | -0.4 | 0.8 | -3.4 | -2.0 | -1.3 |
| 20 to 24 years | 15.7 | 15.6 | 11.1 | 10.4 | 9.6 | 10.1 | 0.4 | -0.8 | 0.5 | -1.8 | -1.0 | -1.0 |
| 25 years and over | 134.3 | 135.9 | 5.2 | 4.4 | 4.5 | 4.5 | -0.1 | 0.1 | 0.0 | -1.0 | -0.7 | -0.7 |
| 25 to 34 years | 34.0 | 34.8 | 6.6 | 5.6 | 5.8 | 5.8 | 0.2 | 0.2 | 0.0 | -1.2 | -0.8 | -0.8 |
| 35 to 44 years | 32.5 | 32.5 | 5.1 | 4.1 | 4.3 | 4.4 | -0.4 | 0.2 | 0.1 | -1.0 | -0.5 | -0.7 |
| 45 to 54 years | 34.1 | 34.0 | 4.5 | 3.7 | 3.8 | 3.9 | -0.1 | 0.1 | 0.1 | -1.1 | -0.8 | -0.6 |
| 55 years and over | 33.8 | 34.7 | 4.5 | 3.9 | 4.0 | 3.7 | -0.4 | 0.1 | -0.3 | -0.8 | -0.6 | -0.8 |
