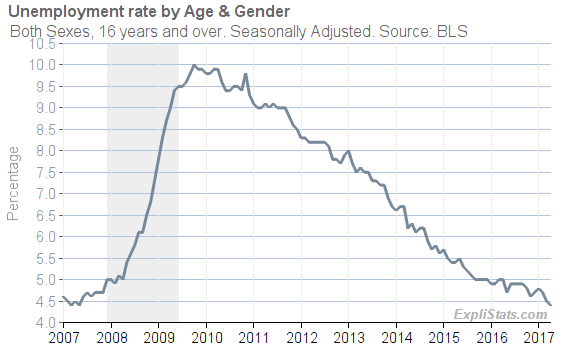
For more charts and tables at finer levels of detail, please visit our Unemployment Dataset Page.

Click to enlarge

Click to enlarge
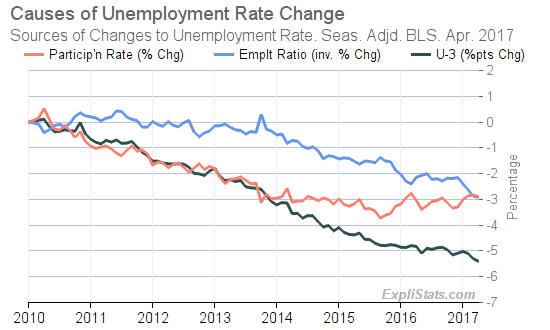
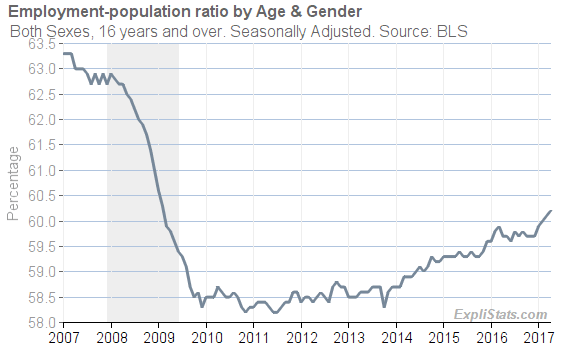
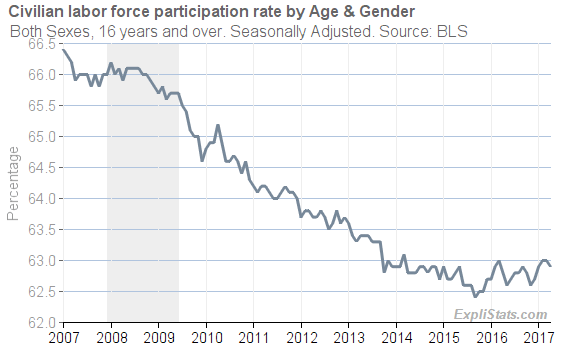
UR = (LR – ER) / LR
Where LR is the Labor Force Participation Rate, and ER is the Employment Ratio. Note how a decrease in the participation rate on its own, reduces the unemployment rate: The number of available workers drops, and thus there are relatively fewer unemployed – even in the absence of job growth. This is what has happened in the recovery since the “Great Recession”.
Click to enlarge

Click to enlarge
| U.S. Unemployment Rate. Seasonally Adjusted. | ||||||||||||
|---|---|---|---|---|---|---|---|---|---|---|---|---|
| Total | Labor Force Mlns | Rate (%) | Monthly Change (%pts) | Year/Year Change (%pts) | ||||||||
| Apr. 2016 | Apr. 2017 | Apr. 2016 | Feb. 2017 | Mar. 2017 | Apr. 2017 | Feb. 2017 | Mar. 2017 | Apr. 2017 | Feb. 2017 | Mar. 2017 | Apr. 2017 | |
| All Ages (16+) | 158.9 | 160.2 | 5.0 | 4.7 | 4.5 | 4.4 | -0.1 | -0.2 | -0.1 | -0.2 | -0.5 | -0.6 |
| 16 to 19 years | 5.9 | 6.0 | 16.0 | 15.0 | 13.7 | 14.7 | 0.0 | -1.3 | 1.0 | -0.6 | -2.2 | -1.3 |
| 20 to 24 years | 15.3 | 15.4 | 8.8 | 8.0 | 7.3 | 7.3 | -0.3 | -0.7 | 0.0 | -0.6 | -1.1 | -1.5 |
| 25 years and over | 137.6 | 138.8 | 4.1 | 3.9 | 3.8 | 3.6 | 0.0 | -0.1 | -0.2 | -0.2 | -0.4 | -0.5 |
| 25 to 34 years | 35.3 | 36.0 | 5.2 | 4.8 | 4.5 | 4.4 | -0.1 | -0.3 | -0.1 | -0.3 | -0.7 | -0.8 |
| 35 to 44 years | 32.8 | 32.9 | 4.0 | 4.1 | 3.9 | 3.6 | 0.2 | -0.2 | -0.3 | 0.3 | 0.0 | -0.4 |
| 45 to 54 years | 34.0 | 33.6 | 3.5 | 3.2 | 3.2 | 3.4 | -0.1 | 0.0 | 0.2 | -0.3 | -0.4 | -0.1 |
| 55 years and over | 35.6 | 36.3 | 3.6 | 3.4 | 3.4 | 3.2 | -0.1 | 0.0 | -0.2 | -0.4 | -0.5 | -0.4 |
This article was generated automatically from our database. We can automate custom reports, spreadsheets and data feeds for our clients. Please contact us with your requirements.
