Click to enlarge
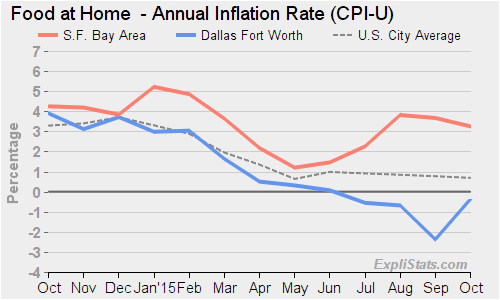
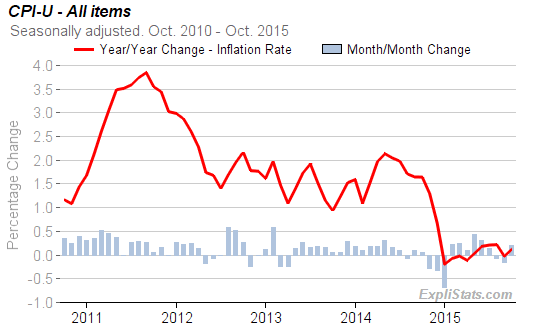
Although national CPI-U All-Items inflation is now at 0.2%, there are some variations across the country, with the San Francisco Bay Area metro showing All Items CPI-U inflation of 2.6%, while the Philadelphia area has an equivalent deflation rate of -0.5%.
In general smaller, regional city sizes have lower inflation or deflation – probably due to the heavier proportion of gasoline in their price index “baskets.”
Sub-indexes (such as “Food at Home” shown above, can have more striking regional differences.
For US national charts and tables at finer levels of detail, please visit our Latest Consumer Price Index Charts and Tables Page.

Click to enlarge
