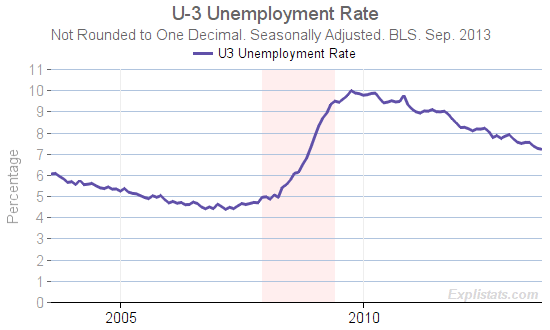
The headline (U-3) Unemployment Rate fell from 7.3% in July to 7.2% in September as published by the Bureau of Labor Statistics today, to one decimal place.
Calculating the rate from the underlying employment and labor force numbers to two decimal places yields a drop from 7.28% to 7.24%.
Overall employment (seasonally adjusted) actually Increased by 133,000 according to the BLS’ Household Survey. Contrast this with the 148,000 increase in Non-Farm jobs reported by the BLS’ Payroll Survey). An unusually close match between those two.

Click to enlarge
The unemployment rate can be regarded as depending on two things: What percentage of the potential adult population is working (the “Employment Ratio”) and what percentage of that same population wants or has a job (the “Participation Rate”).
If the Employment Ratio goes up while the Participation Ration stays the same, this means the same percentage of adults want to work, and more of them have a job. The unemployment rate will drop.
However if the Participation Rate drops while the Employment Ratio stays the same, the unemployment rate will again drop, but this time because fewer people are looking for work.
Doing some mathematics we can work out the contributions to the drop in the unemployment rate which come from both sources. These are presented in the table below.
| Changes in Unemployment Rate to August 2013 in Percentage Points | |||
|---|---|---|---|
| From Sep. 2013 1 Month |
From Sep. 2012 One Year |
||
| Change in Unemployment Rate | -0.042 | -0.56 | |
| Due to Employment Ratio Changes | -0.007 | +0.05 | |
| Due to Participation Rate Changes | -0.035 | -0.60 | |
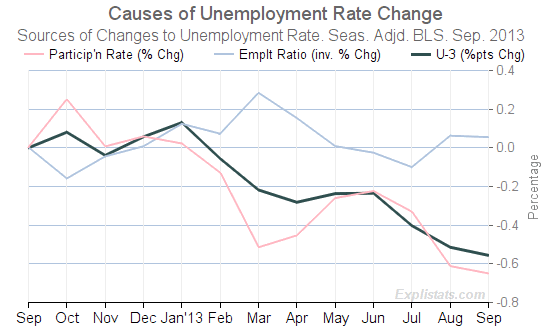
In other words, had the Participation Rate not dropped over the past twelve months, the headline U-3 number would be 7.8% and not 7.2%.

Click to enlarge
The chart to the right shows the percentage drop in the Employment Ratio (inverted) and the Participation Rate in percentage terms since September 2012, together with the change in the unemployment rate in percentage point terms.
Note that these do not plot the actual contributions, but since the numerical weightings currently operating, the percentage change in the two underlying rates is a good proxy for their contribution to the change in the unemployment rate.
