Some observations on today’s Retail Sales report. We use our individually price-adjusted series to look at “Real” retail sales.

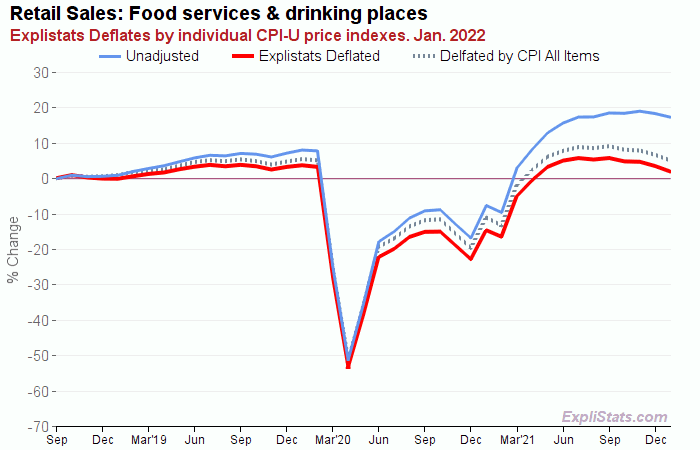
The red-line is our deflation of sales at restaurants, cafes, bars, etc. by the CPI “Food Away From Home” price index. Perhaps that peak in summer was real, or maybe the basket of different kinds of dining/drinking in the CPI has lost track with the pandemic mix.

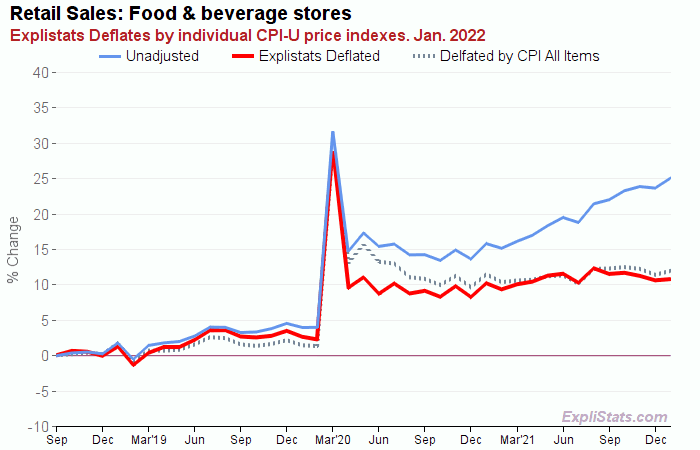
This series covers grocery stores, liquor stores, etc.. Note how the price-adjusted, red line stabilize about 10% above pre-Covid levels. This series should be a quantity indicator is the CPI basket is accurate.
However, people are probably replacing dinner out with grocery purchase which are over-weight in more expensive items. Let’s hope it’s not alcohol.

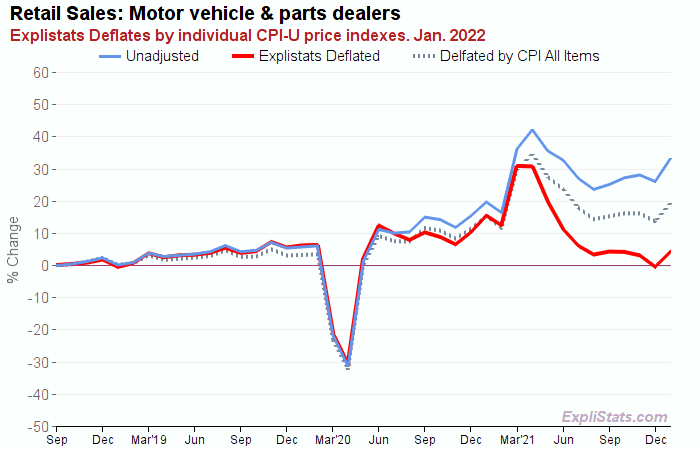
Vehicle sales deflated by CPI New and Used Vehicles price index. Sales uptick but still at pre-pandemic levels. Not the 30% price increase over past two years. (Compare blue and red lines.)

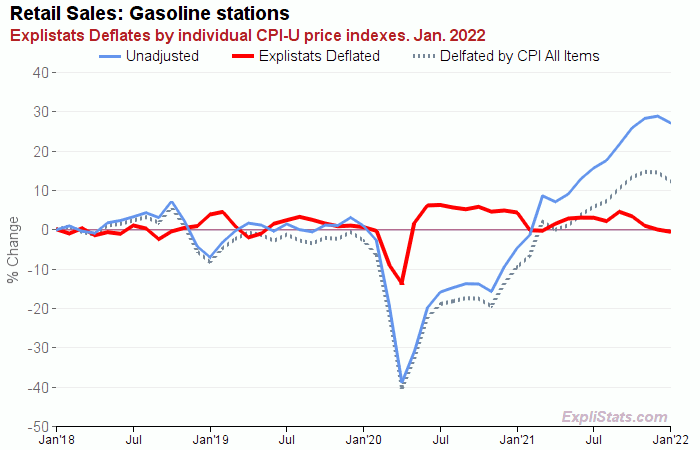
Meanwhile, this chart suggests that last month, the same amount of gas was pumped as four years ago. Less driving, more EV, more fuel efficiency?
