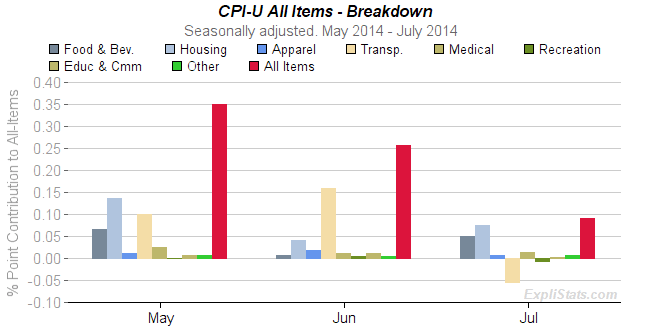
Today’s BLS Survey showed a seasonally adjusted monthly increase of 0.09% in the CPI-U All Items index. The year-to-year increase fell slightly to 2.0% from 2.1% IN June.

Food contributed 5 basis points to the overall 9bp (0.09%) rise in July. (Food at Home: 3bp, Away from Home: 2bp).
Housing contributed 7 bp.
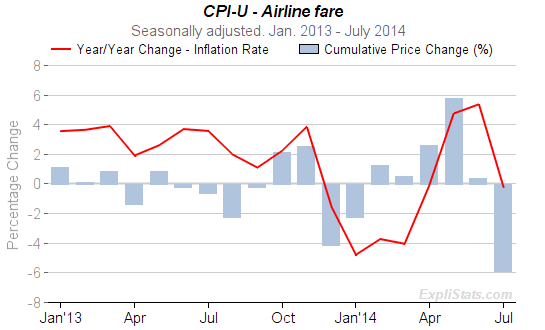
Transportation reduced the monthly All Items rise by 5bp – mostly due to a drop in Airline Fares.

