Click to enlarge
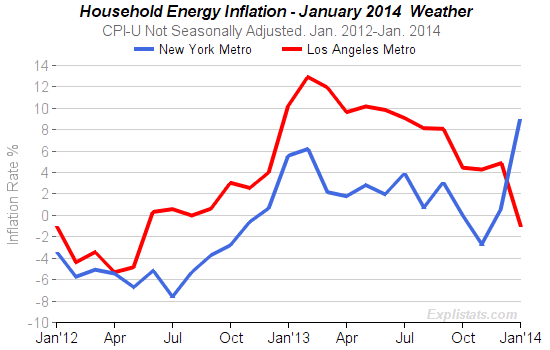
The chart on the right captures two extrems of this. New York metro area year/year household energy prices up 9%. Los Angeles metro’s down by 1%.
See the table below for all regional numbers. NOTE: Because only not seasonally adjusted numbers are available from the BLS, we can only show the year-over-year changes. Thus, moves in January 2014 cannot be disentangled from moves in January 2013. Thus
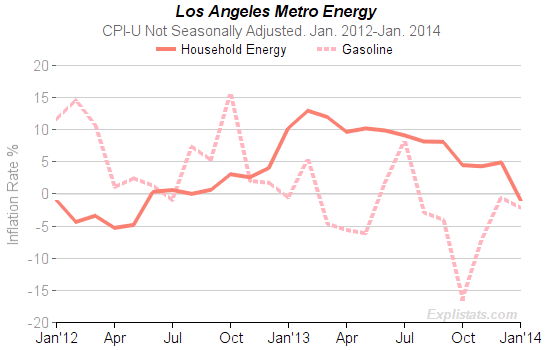
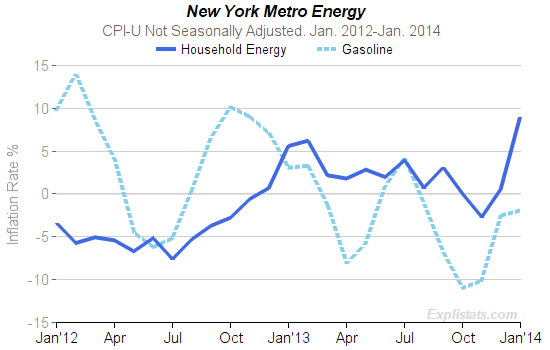
Our other two charts compare Household Energy CPI with Gasoline CPI in the two metro regions.

Click to enlarge

Click to enlarge
| Regional Inflation. Household energy All Urban Consumers (CPI-U). Not Seasonally Adjusted. |
||||||
|---|---|---|---|---|---|---|
| Regions, Sizes & Metros | Year/Year Inflation Rate (%) | |||||
| Dec. 2012 |
Jan. 2013 |
Oct. 2013 |
Nov. 2013 |
Dec. 2013 |
Jan. 2014 |
|
| U.S. city average | -1.1 | -0.4 | 3.0 | 2.2 | 2.4 | 4.8 |
| – Size Class A (more than 1,500,000) | -1.4 | 0.3 | 2.3 | 1.2 | 2.1 | 4.8 |
| – Size Class B/C (between 50,000 and 1,500,000) | -0.7 | -1.0 | 3.8 | 3.2 | 2.6 | 4.8 |
| – Size Class D (under 50,000) | -1.4 | -1.6 | 3.0 | 3.9 | 3.6 | 4.6 |
| Northeast urban | -1.6 | 1.2 | 1.0 | -0.3 | 1.2 | 5.8 |
| – Northeast urban – Size Class A | -0.8 | 1.9 | 0.0 | -1.4 | 0.8 | 6.8 |
| – Northeast urban – Size Class B/C | -3.7 | -0.8 | 3.7 | 2.7 | 2.1 | 3.3 |
| – New York-Northern New Jersey-Long Island, NY-NJ-CT-PA | 0.7 | 5.5 | -0.0 | -2.8 | 0.5 | 9.0 |
| – Philadelphia-Wilmington-Atlantic City, PA-NJ-DE-MD | -2.3 | -3.8 | -1.9 | -1.9 | -1.6 | 2.0 |
| – Boston-Brockton-Nashua, MA-NH-ME-CT | -2.5 | -2.4 | 4.1 | 5.3 | 6.3 | 7.9 |
| Midwest urban | -1.2 | -0.7 | 1.4 | 0.5 | 1.2 | 3.1 |
| – Midwest – Size Class A | -1.4 | -0.1 | 0.6 | -0.8 | 0.2 | 1.6 |
| – Midwest – Size Class B/C | -0.6 | -1.9 | 2.3 | 2.1 | 2.4 | 5.5 |
| – Chicago-Gary-Kenosha, IL-IN-WI | -0.1 | 0.4 | -4.6 | -6.8 | -5.4 | 0.7 |
| – Detroit-Ann Arbor-Flint, MI | -0.1 | -4.5 | -2.1 | -2.0 | -1.4 | -2.7 |
| – Cleveland-Akron, OH | -2.2 | -1.4 | 3.5 | 0.8 | -1.2 | 0.8 |
| – Midwest – Size Class D | -2.4 | -0.3 | 2.2 | 2.5 | 2.5 | 3.1 |
| South urban | -2.0 | -2.8 | 4.4 | 3.3 | 2.3 | 5.1 |
| – South – Size Class A | -4.4 | -4.8 | 4.9 | 3.4 | 2.8 | 5.8 |
| – South – Size Class B/C | -0.7 | -1.7 | 4.2 | 3.2 | 1.8 | 4.5 |
| – South – Size Class D | -1.2 | -2.3 | 3.7 | 3.7 | 2.9 | 5.3 |
| – Washington-Baltimore, DC-MD-VA-WV | -3.7 | -4.2 | 7.3 | 6.8 | 6.5 | 7.0 |
| – Dallas-Fort Worth, TX | 2.0 | 2.6 | 10.7 | 6.0 | 1.4 | 2.7 |
| – Houston-Galveston-Brazoria, TX | – | – | – | – | – | – |
| – Atlanta, GA | -1.7 | 0.4 | 3.0 | 2.2 | 2.1 | 2.1 |
| – Miami-Fort Lauderdale, FL | -1.3 | -0.3 | 0.7 | 0.7 | 0.4 | 5.2 |
| West urban | 1.5 | 2.6 | 4.5 | 5.2 | 5.6 | 5.0 |
| – West – Size Class A | 1.3 | 3.9 | 4.7 | 5.0 | 5.5 | 4.2 |
| – West – Size Class B/C | 2.4 | 1.6 | 4.7 | 5.1 | 5.5 | 6.1 |
| – Los Angeles-Riverside-Orange County, CA | 4.0 | 10.2 | 4.4 | 4.2 | 4.8 | -1.1 |
| – San Francisco-Oakland-San Jose, CA | 1.3 | -0.3 | 4.3 | 4.4 | 5.0 | 7.5 |
| – Seattle-Tacoma-Bremerton, WA | 0.3 | 1.8 | 1.6 | 2.9 | 3.1 | 3.4 |
