Both the CPI-U and CPI-W overall (“All Items”) consumer price indexes rose in January, on a seasonally adjusted basis by 0.14%. The rises came almost entirely from a rise in (seasonally adjusted) household energy prices which were offset by falling gasoline prices.
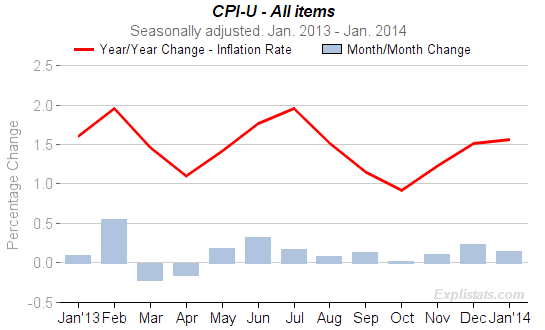
Headline, year over year, unadjusted CPI-U inflation is little changed at 1.58%.

Click to enlarge
It would appear that this divergence was caused by severe weather in most parts of the country in January. More on this in a later post.
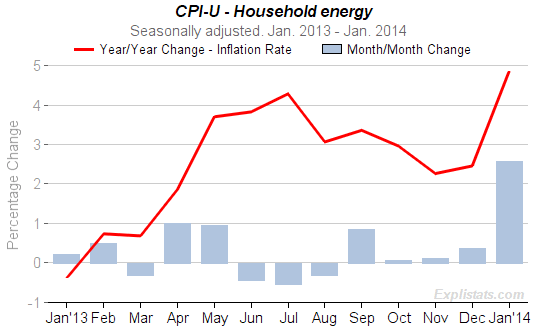
Note the sharp monthly rise in January 2014 of 2.6% which, given this sector’s weighting in the All Items index, contributed 0.10% to the All Items rise of 0.14%.
| Consumer Price Indexes. Seasonally Adjusted. | ||||||
|---|---|---|---|---|---|---|
| All Items Index | Monthly % Chg. | Annual % Chg. | ||||
| Jan. 2013 |
Dec. 2013 |
Jan. 2014 |
Jan. 2013 |
Dec. 2013 |
Jan. 2014 |
|
| All Urban Consumers (CPI-U) | 0.10 | 0.24 | 0.14 | 1.61 | 1.51 | 1.56 |
| Urban Wage Earners & Clerical Workers (CPI-W) | 0.06 | 0.28 | 0.14 | 1.50 | 1.47 | 1.55 |

The CPI-U All items can be seen trending down, in terms of year/year change (red line) in this chart.
Note how January 2013’s rise was slightly smaller than this month’s.
(Note, the red-line shows the seasonally-adjusted annual change, which differs slightly from the unadjusted rate.)
Note also the large February 2013 gain. If next month’s housing fuel costs drop back down to normal levels, there is the possibility of February 2014’s monthly move being near or below zero. With this replacing the 0.5% February 2013 increase, we could see headline inflation back around 1.0%
Contributions to this month’s CPI-U change
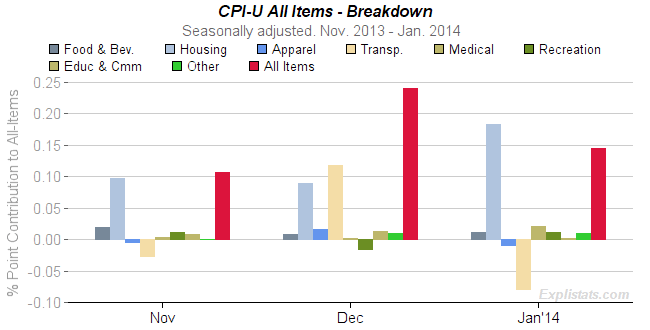
The CPI-U monthly change of +0.14% (+14 bp) can be attributed to the individual sub-indexes making up the All Items.The table below and chart show the contributions for the past three months for the top-level, sub-sectors.
At a finer level of Expenditure Group the following were the major contrubutors:
-5 bp to Gasoline (within Transportation),
(other Motor Fuels sub-index, unchanged)
+10 bp to Household Energy (Housing)
+5 bp to Owner’s Equivalent Rent of Home (Housing),
Below we show in graphical form, the contributions of the major sectors over the past three months.
| Contributions to All-Items Monthly % Change All items. CPI-U. Seasonally Adjusted. 100 Basis Points = 1% (May not add to total due to rounding.) |
|||
|---|---|---|---|
| Expenditure Group | Basis Points | ||
| Nov. 2013 |
Dec. 2013 |
Jan. 2014 |
|
| All Items | 11 | 24 | 14 |
| Food and Beverages | 2 | 1 | 1 |
| Housing | 10 | 9 | 18 |
| Apparel | -1 | 2 | -1 |
| Transportation | -3 | 12 | -8 |
| Medical Care | 0 | 0 | 2 |
| Recreation | 1 | -2 | 1 |
| Education and Communication | 1 | 1 | 0 |
| Other Goods and Services | 0 | 1 | 1 |

Click to enlarge
