Following on from our comparison of national OpenTable.com dining with payroll employment, we have looked at the regional data.
With the data in our system, we compiled a few charts to see how different states, and metros have tackled their post-lockdown openings.
We will combine this with the July local employment data due from the Bureau of Labor Statistics next week.
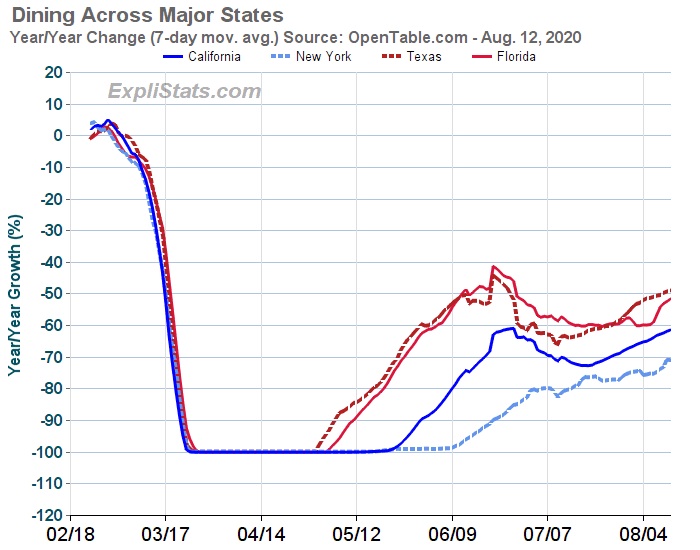
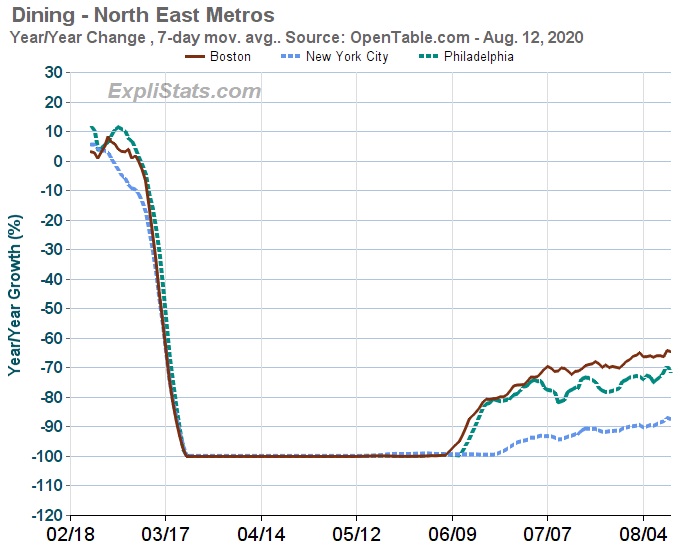
But, on dining alone, we see that the North East, hit hard by Covid, delayed re-opening and has since seen a steady, if low growth in dining. Other states which opened earlier saw more of a surge in dining, but followed by a return to growth at a slower level.
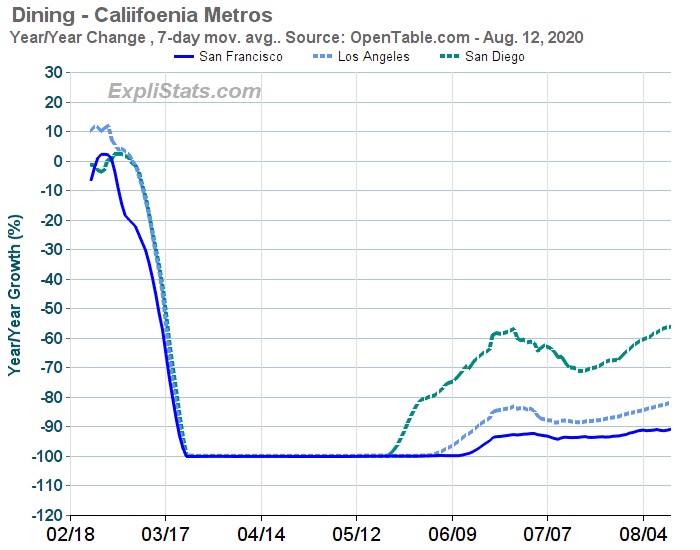
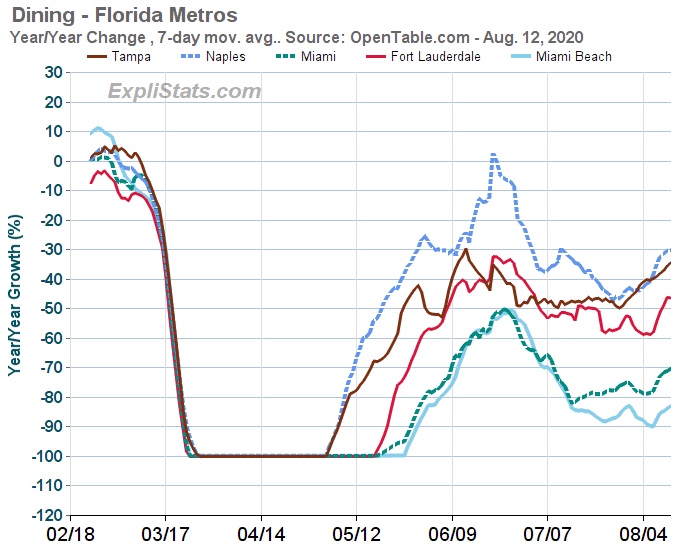
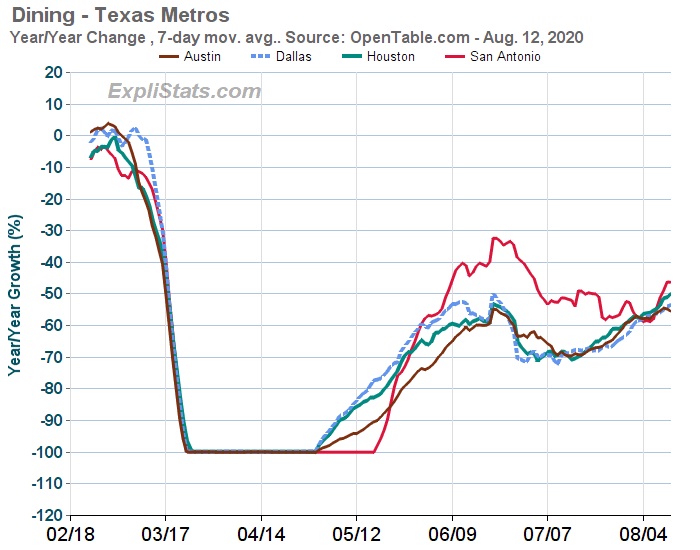
First, a comparison of four major states, followed by comparison of metros within these states (and the broader North East.)
Contrast San Francisco with Naples, FL!