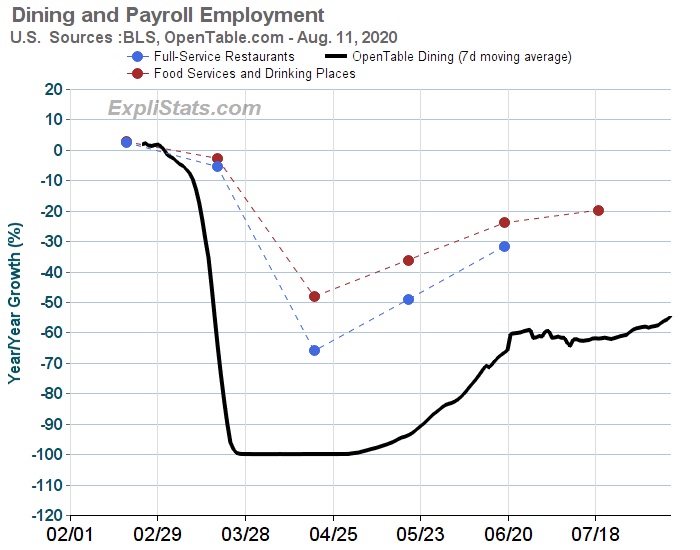
OpenTable.com is helpfully publishing data on what they see in year-over-year dining reserved through their service.
We plan on taking a look at the regional picture, but in this chart we plot their national data against the Payroll Survey estimates of two related employment sectors.
“Full-Service Restaurants” is most closely related to the Open Table data, but it is published with a one-month lag by the Bureau of Labor Statistics.
Join our email list to get our updates to this and other charts.