For more charts and tables at finer levels of detail, please visit our Latest Consumer Price Index Charts and Tables Page.
From the Bureau of Labor Statistics’ News Release:
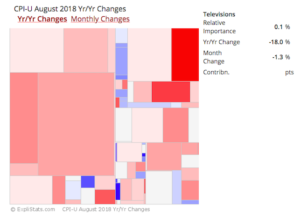
The Consumer Price Index for All Urban Consumers (CPI-U) increased 0.2 percent in August on a seasonally adjusted basis, the same increase as in July, the U.S. Bureau of Labor Statistics reported today. Over the last 12 months, the all items index rose 2.7 percent before seasonal adjustment. Increases in the indexes for shelter and energy were the main contributors to the seasonally adjusted monthly increase in the all items index. The energy index increased 1.9 percent in August; a 3.0-percent increase in the gasoline index was the largest factor, but the other energy component indexes also rose. The shelter index increased 0.3 percent in August, the same increase as in July. The food index rose only slightly in August, with the index for food at home unchanged.
Click to enlarge
Contributions to this month’s rise in the index can be found in the rigth-most column of this table:
See contributions of sub-sectors for further break-outs.
| Contributions to All-Items Monthly % Change All items. CPI-U. Seasonally Adjusted. 100 Basis Points = 1% (May not add to total due to rounding.) | |||
|---|---|---|---|
| Expenditure Group | Basis Points | ||
| June 2018 | July 2018 | Aug. 2018 | |
| All Items | 13 | 17 | 22 |
| Food and Beverages | 3 | 2 | 1 |
| Housing | -0 | 10 | 12 |
| Apparel | -3 | -1 | -5 |
| Transportation | 7 | 5 | 15 |
| Medical Care | 4 | -2 | -2 |
| Recreation | 1 | 1 | -0 |
| Education and Communication | 1 | 2 | 1 |
| Other Goods and Services | -0 | 0 | -0 |
The same contributions in the above table are shown here graphically:
This article was generated automatically from our database. We can automate custom reports, spreadsheets and data feeds for our clients. Please contact us with your requirements.