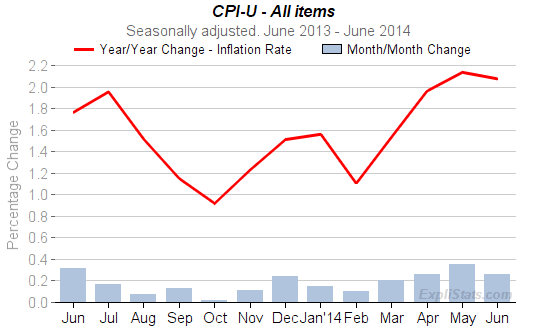
Click to enlarge
Please visit our CPI Charts & Tables page for more data.
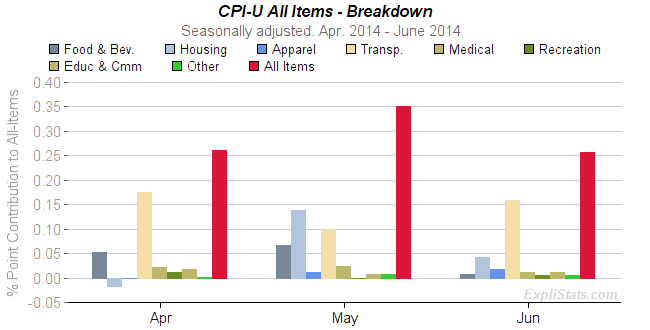
Almost all of June’s increase came from a rise in (Seasonally Adjusted) motor fuel which contributed 0.17% of the overall 0.26% increase.
Please visit the contributions tables to view the details for both CPI-U and CPI-W. Below we show the top-level sectors’ contributions in a chart and table.

Click to enlarge
| Contributions to All-Items Monthly % Change All items. CPI-U. Seasonally Adjusted. 100 Basis Points = 1% (May not add to total due to rounding.) |
|||
|---|---|---|---|
| Expenditure Group | Basis Points | ||
| Apr. 2014 |
May 2014 |
June 2014 |
|
| All Items | 26 | 35 | 26 |
| Food and Beverages | 5 | 7 | 1 |
| Housing | -2 | 14 | 4 |
| Apparel | -0 | 1 | 2 |
| Transportation | 18 | 10 | 16 |
| Medical Care | 2 | 2 | 1 |
| Recreation | 1 | -0 | 1 |
| Education and Communication | 2 | 1 | 1 |
| Other Goods and Services | 0 | 1 | 1 |
