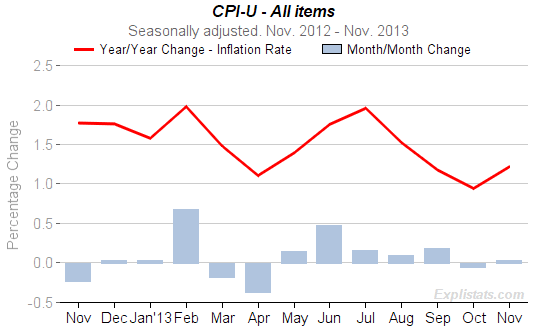
Both the CPI-U and CPI-W overall (“All Items”) consumer price indexes were unchanged in November (to one decimal place), on a seasonally adjusted basis. A small drop in Gasoline prices (0.1%) was balanced by a similarly sized rise in Shelter.
However, because of drop in the index in November 2012, which has now fallen out of the annual rate, the year over year inflation level for both indexes is now back above 1%.The annual change (inflation rate) for the two indexes now stand below 1%.
| Consumer Price Indexes. Seasonally Adjusted. | ||||||
|---|---|---|---|---|---|---|
| All Items Index | Monthly % Chg.Seasonally Adjusted. | Annual % Chg.Not Seasonally Adjusted. | ||||
| Nov. 2012 |
Oct. 2013 |
Nov. 2013 |
Oct. 2013 |
Nov. 2013 |
||
| All Urban Consumers (CPI-U) | -0.24 | -0.06 | 0.03 | 0.96 | 1.24 | |
| Urban Wage Earners & Clerical Workers (CPI-W) | -0.36 | -0.11 | -0.01 | 0.77 | 1.12 | |
 The CPI-U All items can be seen trending down, in terms of year/year change (red line) in this chart.
Note how November 2012’s drop was large relative to this month’s.
(Note, the red-line shows the seasonally-adjusted annual change, which differs slightly from the unadjusted rate.)
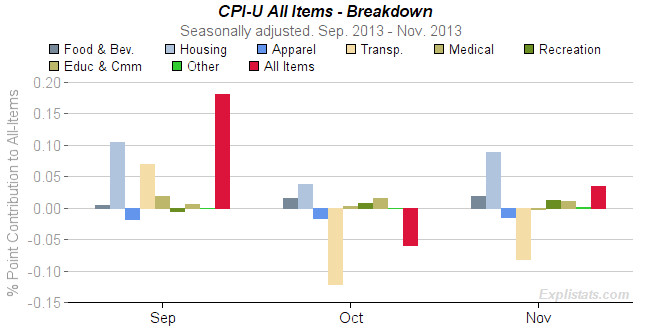
The CPI-U monthly change of -0.03% (-3 bp, basically flat) can be attributed to the individual sub-indexes making up the All Items.The table below and chart show the contributions for the past three months for the top-level, sub-sectors. The contributions may not appear to add to the All Items total because of rounding.
At a finer level of Expenditure Group the following were the major contrubutors:
– 8bp to Gasoline (within Transportation),
+ 3bp to Airline Fares (within Transportation)
+6bp to Owner’s Equivalent Rent of Home (Housing),
+2bp to Lodging away from Home
Below we show in graphical form, the contributions of the major sectors over the past three months.
| Contributions to All-Items Monthly % Change All items. CPI-U. Seasonally Adjusted. 100 Basis Points = 1% (May not add to total due to rounding.) |
|||
|---|---|---|---|
| Expenditure Group | Basis Points | ||
| Sep. 2013 |
Oct. 2013 |
Nov. 2013 |
|
| All Items | 18 | -6 | 3 |
| Food and Beverages | 0 | 2 | 2 |
| Housing | 10 | 4 | 9 |
| Apparel | -2 | -2 | -1 |
| Transportation | 7 | -12 | -8 |
| Medical Care | 2 | 0 | -0 |
| Recreation | -1 | 1 | 1 |
| Education and Communication | 1 | 1 | 1 |
| Other Goods and Services | 0 | -0 | 0 |

Click to enlarge
