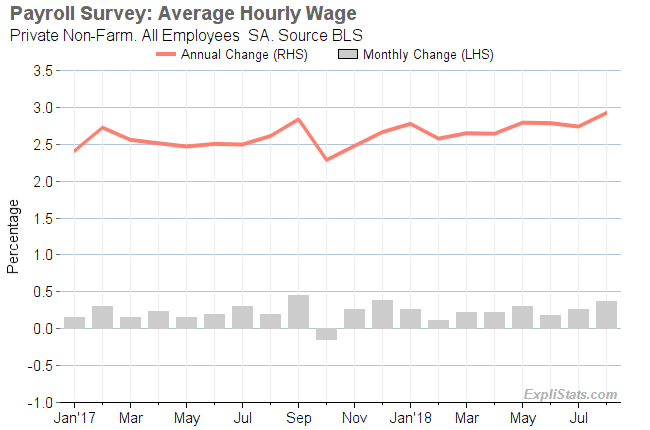
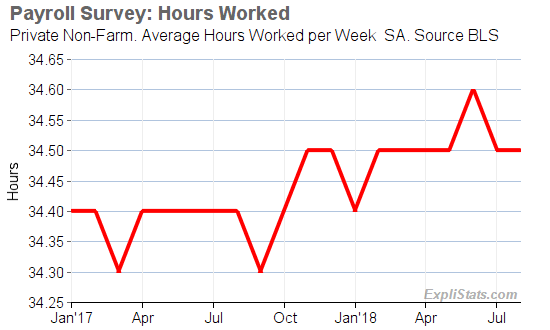
The average year-to-year change in average hourly wage for All Employees was reported today, as 2.8% by the Bureau of Labor Statistics.
The BLS also publishes industry specific wage rates, and separate number for Production/Non-Supervisory workers. From the latter we can impute average wage rises for Supervisory/Management workers.
We show those for the first level of industry sectors below – in table and “bubble chart” format
Be aware, though, that the imputed Management rates suffer from being the difference of two estimates, and point to disparities in how All Employees and Non-Production Employees are statistically modeled by the BLS
Mouse over each bubble to obtain a data pop-up
| BLS Code | Industry Sector | Prodn. | Super. | Prodn. | Super. | Prodn. | Super. |
|---|---|---|---|---|---|---|---|
| 05000000 | Total Private | 104,568.0 | 22,371.0 | $22.73 | $45.69 | 2.80% | 3.67% |
| 10000000 | Mining and logging | 553.0 | 193.0 | $28.41 | $45.47 | 3.42% | 1.40% |
| 20000000 | Construction | 5,401.0 | 1,858.0 | $27.73 | $36.88 | 3.32% | 2.72% |
| 31000000 | Durable Goods Manuf. | 5,459.0 | 2,491.0 | $22.46 | $43.01 | 2.37% | 2.84% |
| 32000000 | Non-Durable Goods Manuf. | 3,455.0 | 1,312.0 | $19.88 | $39.08 | 2.85% | -2.95% |
| 41420000 | Wholesale trade | 4,821.3 | 1,185.8 | $25.25 | $52.50 | 2.14% | 2.63% |
| 42000000 | Retail trade | 13,592.3 | 2,321.2 | $15.96 | $34.06 | 4.04% | 4.85% |
| 43000000 | Transportation and warehousing | 4,655.9 | 693.1 | $21.94 | $39.71 | 2.52% | 0.82% |
| 44220000 | Utilities | 441.0 | 109.5 | $36.97 | $57.38 | 2.92% | 11.56% |
| 50000000 | Information | 2,223.0 | 539.0 | $31.91 | $70.11 | 3.81% | 1.67% |
| 55000000 | Financial activities | 6,649.0 | 1,939.0 | $26.89 | $60.90 | 0.82% | 9.91% |
| 60000000 | Professional and business services | 17,202.0 | 3,860.0 | $26.83 | $55.76 | 2.92% | 2.47% |
| 65000000 | Education and health services | 20,844.0 | 2,888.0 | $23.72 | $47.50 | 2.68% | 2.20% |
| 70000000 | Leisure and hospitality | 14,401.0 | 1,973.0 | $13.91 | $26.75 | 3.57% | 0.70% |
| 80000000 | Other services | 4,870.0 | 1,009.0 | $20.60 | $39.48 | 2.03% | 1.11% |


