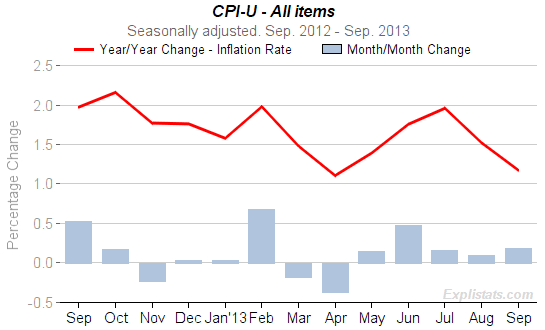
Both the CPI-U and CPI-W overall (“All Items”) consumer price indexes rose in September, on a seasonally adjusted basis by 0.18%. However the annual change (inflation rate) differs for the two indexes: CPI-U year-year inflation rate is 1.18% while the CPI-W’s is 1.02%.
The difference between the two indexes lie in their relative weightings of different expenditure groups, and the related fact that both experienced different monthly changes last September.
Last September, the CPI-U and CPI-W indexes rose by 0.52% and 0.61% respectively, with that rise being replaced by September 2013’s small rise, the year-to-year price change – “inflation” – dropped heavily. For the CPI-U from around 1.5% in August, and from around 2% only two months ago (due to a similarly large August 2012 price rise dropping out of annual inflation).
| Consumer Price Indexes. Seasonally Adjusted. | ||||
|---|---|---|---|---|
| All Items Index | Monthly % Chg. | Annual % Chg. | ||
| Sep. 2012 |
Sep. 2013 |
Sep. 2012 |
Sep. 2013 |
|
| All Urban Consumers (CPI-U) | 0.52 | 0.18 | 1.97 | 1.18 |
| Urban Wage Earners & Clerical Workers (CPI-W) | 0.61 | 0.18 | 1.99 | 1.02 |
 The CPI-U All items can be seen trending down, in terms of year/year change (red line) in this chart.
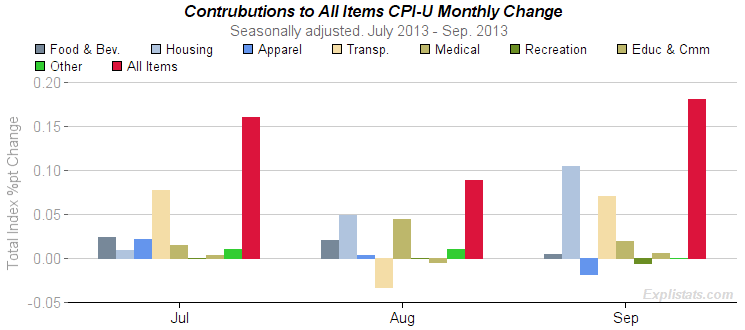
The CPI-U monthly change of 0.18% (18 bp) can be attributed to the individual sub-indexes making up the All Items.The table below and chart show the contributions for the past three months for the top-level, sub-sectors. The contributions may not appear to add to the All Items total because of rounding.
Of the 18bp the following can be attributed to finer-detailed price indexes:
5bp to Motor Fuel (within Transportation),
5bp to Owner’s Equivalent Rent of Home (Housing),
3bp to Electricity and Piped-gas to the home (Housing),
| Contributions to All-Items Monthly % Change All items. CPI-U. Seasonally Adjusted. 100 Basis Points = 1% (May not add to total due to rounding.) |
|||
|---|---|---|---|
| Expenditure Group | Basis Points | ||
| July 2013 |
Aug. 2013 |
Sep. 2013 |
|
| All Items | 16 | 9 | 18 |
| Food and Beverages | 2 | 2 | 0 |
| Housing | 1 | 5 | 10 |
| Apparel | 2 | 0 | -2 |
| Transportation | 8 | -3 | 7 |
| Medical Care | 1 | 4 | 2 |
| Recreation | 0 | -0 | -1 |
| Education and Communication | 0 | -0 | 1 |
| Other Goods and Services | 1 | 1 | 0 |

Click to enlarge
