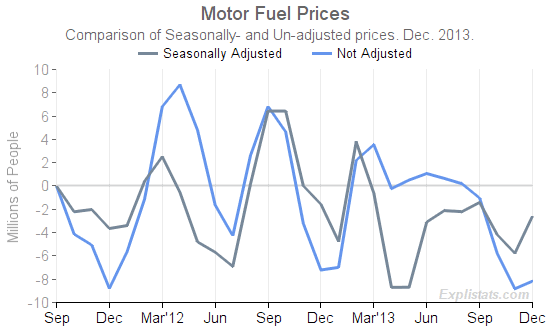
Both the CPI-U and CPI-W overall (“All Items”) consumer price indexes rose in December, on a seasonally adjusted basis by 0.30% and 0.34% respectively. The rises came almost entirely from a rise in (seasonally adjusted) Motor Fuel prices (3.4%) and in housing costs of Primary Residence (0.3%).
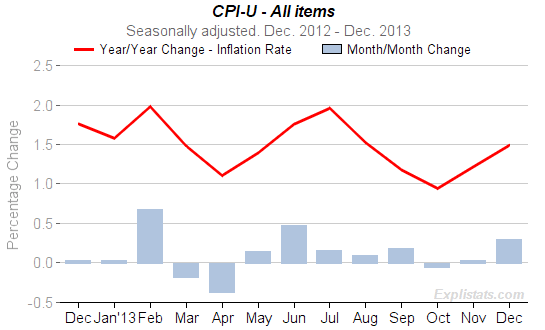
And, because the index was almost flat in December 2012, the year over year inflation level for both indexes has risen by about 0.3% compared to last month’s inflation rate. The annual change (inflation rate) for the two indexes now stand at 1.49% and 1.44%.
| Consumer Price Indexes. Seasonally Adjusted. | ||||||
|---|---|---|---|---|---|---|
| All Items Index | Monthly % Chg. | Annual % Chg. | ||||
| Dec. 2012 |
Nov. 2013 |
Dec. 2013 |
Dec. 2012 |
Nov. 2013 |
Dec. 2013 |
|
| All Urban Consumers (CPI-U) | 0.03 | 0.03 | 0.30 | 1.76 | 1.22 | 1.49 |
| Urban Wage Earners & Clerical Workers (CPI-W) | 0.00 | -0.01 | 0.34 | 1.71 | 1.10 | 1.44 |
 On an underlying basis, before seasonal adjustment, Motor Fuel prices posted a small gain of 0.7%, but because prices usually drop sharply in December (see chart at left), the seasonal adjustment process sees this as an underlying rise of 3.4%. Given the unusual weather during December, this may not be a true reflection of an underlying trend.

The CPI-U All items can be seen trending down, in terms of year/year change (red line) in this chart.
Note how December 2012’s rise was small relative to this month’s.
(Note, the red-line shows the seasonally-adjusted annual change, which differs slightly from the unadjusted rate.)
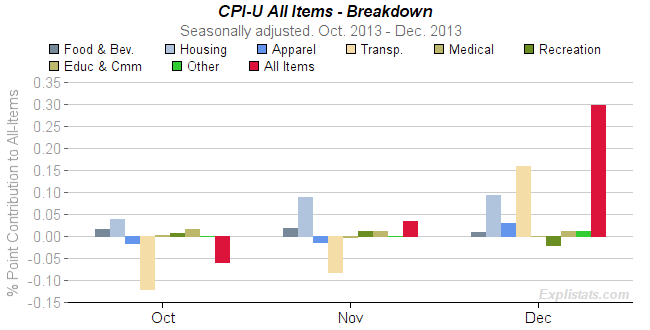
The CPI-U monthly change of +0.30% (+30 bp) can be attributed to the individual sub-indexes making up the All Items.The table below and chart show the contributions for the past three months for the top-level, sub-sectors. The contributions may not appear to add to the All Items total because of rounding.
At a finer level of Expenditure Group the following were the major contrubutors:
+19 bp to Motor Fuel (within Transportation),
-4 bp to Airline Fares (within Transportation)
+6 bp to Owner’s Equivalent Rent of Home (Housing),
Below we show in graphical form, the contributions of the major sectors over the past three months.
| Contributions to All-Items Monthly % Change All items. CPI-U. Seasonally Adjusted. 100 Basis Points = 1% (May not add to total due to rounding.) |
|||
|---|---|---|---|
| Expenditure Group | Basis Points | ||
| Oct. 2013 |
Nov. 2013 |
Dec. 2013 |
|
| All Items | -6 | 3 | 30 |
| Food and Beverages | 2 | 2 | 1 |
| Housing | 4 | 9 | 9 |
| Apparel | -2 | -1 | 3 |
| Transportation | -12 | -8 | 16 |
| Medical Care | 0 | -0 | 0 |
| Recreation | 1 | 1 | -2 |
| Education and Communication | 1 | 1 | 1 |
| Other Goods and Services | -0 | 0 | 1 |

Click to enlarge
