For those interested in more detail behind the following, please contact us – we will be happy to discuss further.
The Bureau of Labor Statistics will publish its March Payrolls Survey on Friday, April 4th.
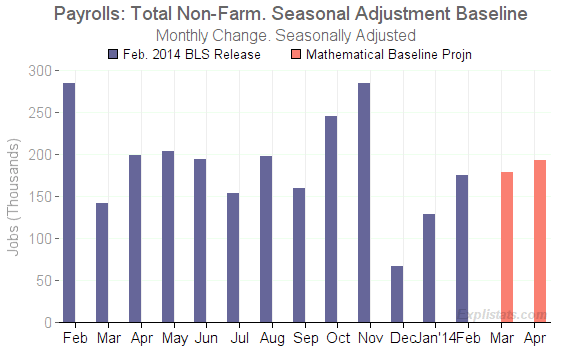
Barring revisions to February and January numbers the underlying mathematical trend projects an increase of 178,000 jobs in March. This follows last month’s BLS estimate of a Febraury increase of 175,000. (Total Non-Farm, Seasonally Adjusted).
Mathematical Baseline Numbers for March – Assuming No Change in Economic Trend
Projected monthly increase in seasonally-adjusted payroll numbers for March are compared with last month’s actually reported numbers (Change in Thousands of Jobs).
| Sector | Feb. Actual | Mar. Projection |
|---|---|---|
| Total Non-Farm | 175,000 | 178,000 |
| Private | 162,000 | 187,000 |
| Government | 13,000 | -9,000 |
Note the projected drop in Govt. jobs. Remember (see below) this is purely coming from the mathematical model’s parametric fit of historic data – there is no insight as to whether, say, the US Postal Service has indeed laid off 5,000 more employees in March.
Review of Last Month’s Trend Projection
Actual BLS February numbers (although yet to be revised) showed an increase from January’s numbers, though not as large as the January trend model predicted.
| Sector | Jan. Actual | Feb. Projection | Feb. Actual |
|---|---|---|---|
| Total Non-Farm | 123,000 | 183,000 | 175,000 |
| Private | 142,000 | 184,000 | 162,000 |
| Government | -29,000 | -1,000 | 13,000 |
The Seasonal Adjustment Process
Most industries see job levels rise and fall due to the time of year. In order to get a view of any underlying, non-seasonal changes, a mathematical procedure is used to “seasonally adjust” the data, stripping out calendar effects.
The mathematics used by the Bureau of Labor Statistics in seasonally adjusting the raw payroll data is complex. It has a difficult task and does not perform perfectly. There are residual biases in the output numbers and these will tend to persist in future months, although they will change as new data are fed in each month.
We look at these BLS biases with a view to preparing for the actual numbers in the next BLS release.

Click to enlarge
Applying the biases with no changes in trend
To get a feel for the effect of these biases, we compute what the next few months’ reported growth in payrolls would be, if:
- The underlying momentum of the jobs growth seen in recent months were to continue.
- No major reporting errors caused by employers failing to report their survey data on time
The results for March overall payroll numbers are shown in the table and chart above.
Now, both of the assumptions (1) and (2) are significant, and so our bias-numbers cannot be treated as a forecast, but more of a “baseline”. If the effect of (2) is small, then we can look at how the actual March numbers compare with this baseline and deduce from that something about any change in momentum.
