The Purest Version of the BLS Seasonally-Adjusted Payroll Data.

Over 100 Industry Sectors
Delivered within 2 Business Days
of Survey Publication:
$79 monthly
Within 3 Hours:
$375 monthly
Revisions and Revisions and Revisions.
The public perception is that each month the BLS revises the prior two months, and annually, a benchmark revision is made to the past five years. But, in fact, each month the BLS revises the seasonal adjustment for the past five years.
They just do not publish those revisions. This makes the published data series internally inconsistent.
Full details of the BLS revision process.
How, What, Why?
For historical reasons, the BLS continues to publish as if only the prior two months have been revised. This occurred with the introduction of the X-12-ARIMA seasonal adjustment process in 2004.
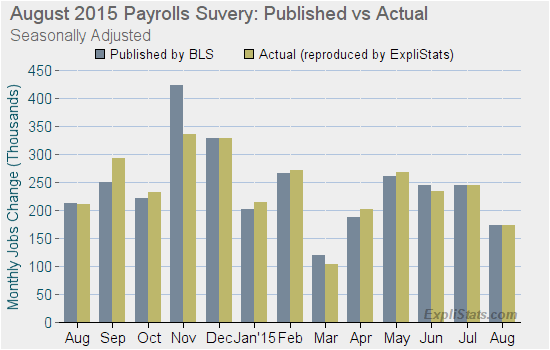
In the August 2015 survey the BLS published their current estimates for the the Total Non-Farm employment level and changes. These included out-dated estimates for months before June. In the chart above and the table below we show the actual numbers produced internally by the BLS in August, and those they published.
| August 2015 Survey |
Jobs Level (1000s) | Jobs Change (1000s) | ||
| Publ. | Actual | Publ. | Actual | |
|---|---|---|---|---|
| August 2015 | 142,288 | 142,288 | 173 | 173 |
| July | 142,115 | 142,115 | 245 | 245 |
| June | 141,870 | 141,870 | 245 | 234 |
| May | 141,625 | 141,636 | 260 | 267 |
Note the differences between Published and Actual for the May levels and the May & June changes. This difference holds for all months prior to June.
The BLS is mixing apples and oranges here: The June through August published numbers are the actual ones produced by the seasonal adjustment process in the August survey. But the published number for the May level was produced by the July report’s seasonal adjustment.
Not only are apples and oranges mixed in that first column: In the third column the BLS actually subtracts oranges (the old May number) from apples (the current estimate for June) to get the 245,000 change published for June. The correct new number for June’s change is 234,000.
A similar though more complicated situation even takes place when the annual benchmark is announced with each year’s January release.
| January 2015 Survey |
Jobs Level (1000s) | Jobs Change (1000s) | ||
| Publ. | Actual | Publ. | Actual | |
|---|---|---|---|---|
| January 2015 | 140,849 | 140,849 | 257 | 257 |
| December 2014 | 140,592 | 140,592 | 329 | 329 |
| November | 140,263 | 140,263 | 423 | 340 |
| October | 139,923 | 139,840 | 221 | 263 |
The figure of 423,000 for the revised November jobs growth attracted great attention at the time of its publication in the January 2015 survey, but very few people outside of the BLS were aware that 83,000 of that change was an artifact of the publication process.
UPDATE: February 2016: Consistent Payrolls – Confirmation
How We Get the Actual Results
When the move to X-12-ARIMA was made in 2004. the BLS made public its decision not to publish the full ARIMA results, together with a promise to provide the mechanics of the ARIMA process, if not the results, so that the public could reproduce the unpublished results.
ExpliStats availed itself of this offer, and of the help of BLS CES (Payroll Survey) staff in replicating the process. This allows us to recalculate the full, internal BLS results (with some minor inaccuracies – due to non-publication of some unadjusted data by the BLS).
These are the data which are shown as “Actual” in the tables and chart above.
“ExpliStats Consistent Payroll Series” – The Purest Version of the BLS Seasonally-Adjusted Payroll Data.
For anyone who wants to understand how the last month’s headline growth may have borrowed or lent from past months, or who wants to perform a consistent, time-series modelling of the payroll numbers, the Actual data is a necessity.
This data series, shows the seasonally-adjusted BLS payroll data in consistent form (apples only), in a manner not otherwise available to the public. The benefit of the ExpliStats reporting of the actual numbers is the consistency of the historical series. Consistency eliminates distortion in month-to-month comparisons of payroll changes, and it provides data users—who rely on historical data—with consistent numbers for modeling and analysis.

