See also: The Purest Version of the BLS Seasonally-Adjusted Payroll Data.
In this article:
- How the BLS Seasonal Adjustment process is conducted for the Payroll Survey.
- How the BLS' legacy publishing system distorts the results.
- How Explistats calculates, and can provide, an accurate set of BLS results.
For anyone who wants to understand how the last month's headline growth may have borrowed or lent from past months, or who wants to perform a consistent, time-series modelling of the payroll numbers, the actual ARIMA (seasonally adjusted) data are a necessity.
Details of data availability to our clients at the foot of this page.
New Data and the Seasonal Adjustment Process
Each month, the BLS receives new survey data for that month, plus revised data for the prior two months. These data are unadjusted for seasonal variations and must be adjusted by a complex mathematical procedure to give a better insight into growth trends.
This adjustment procedure uses a set of X-12-ARIMA models ("ARIMA") which treat the past five years of data as a whole, and adjusts all of the past five years' data each month.
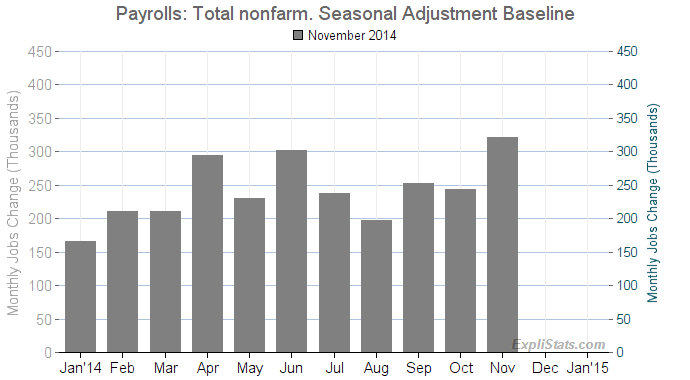
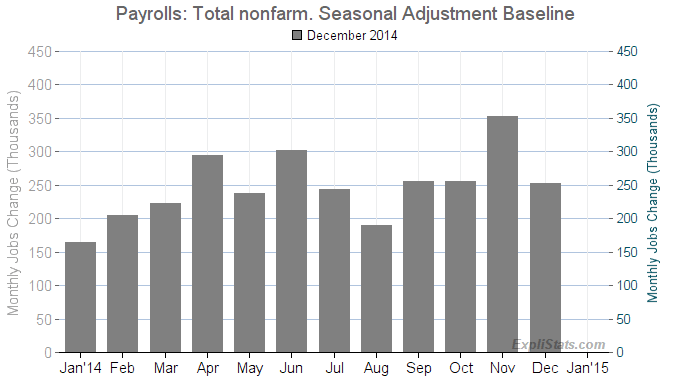
For example, with the December 2014 release, an estimate for the December jobs level was obtained by the survey. In addition, updates were received for the surveys in October and November. The three new jobs levels for October, November and December were entered into ARIMA and the process produced its output. The seasonally adjusted output contained not only a brand new figure for December, and fresh figures for November and October, but also revisions to the numbers going back five years.
Even although the raw, unadjusted jobs levels for September and before had not changed, their "seasonal factors" had been recalculated and (hopefully) improved with the new October through December data.
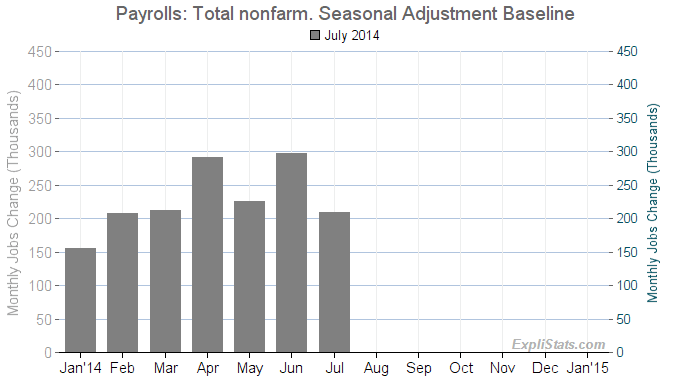
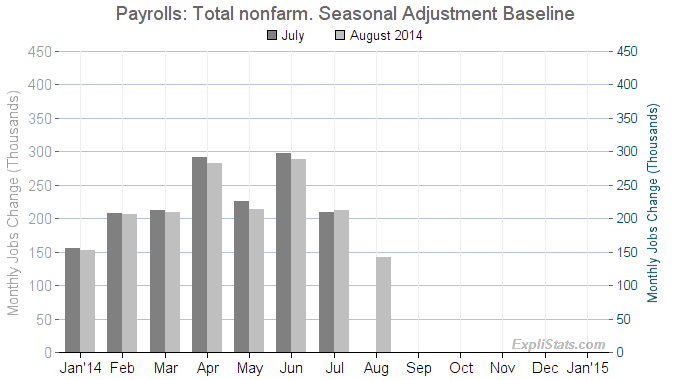
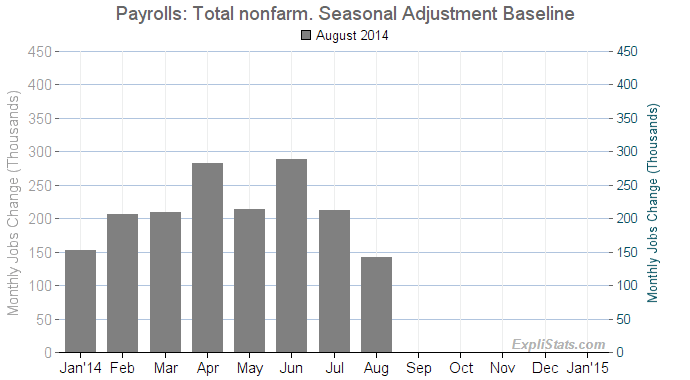
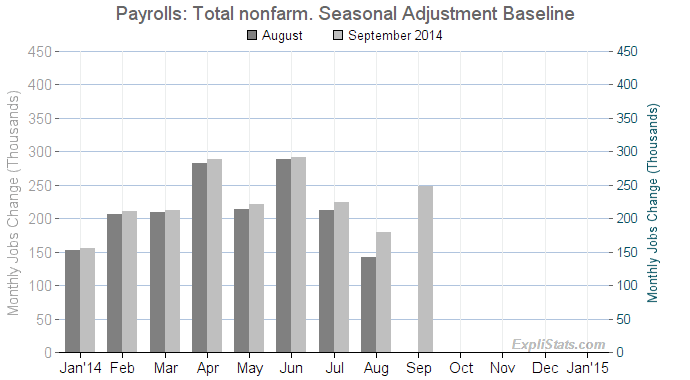
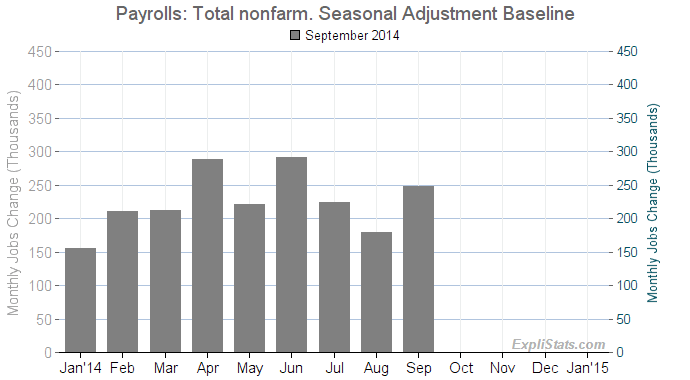
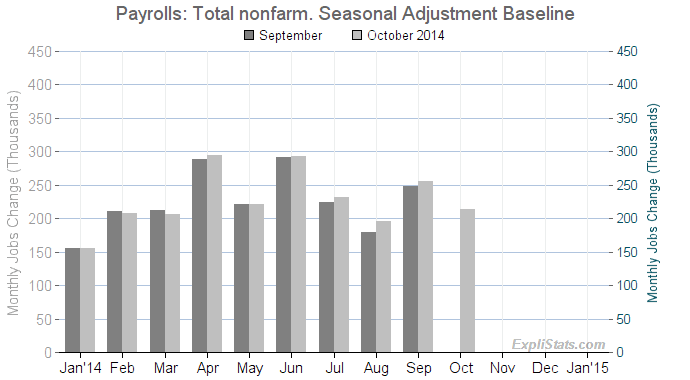
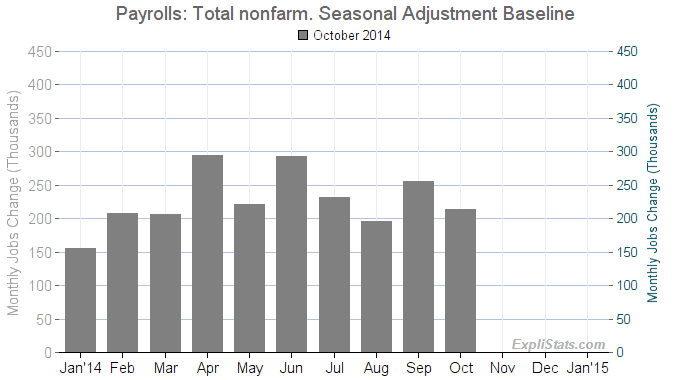
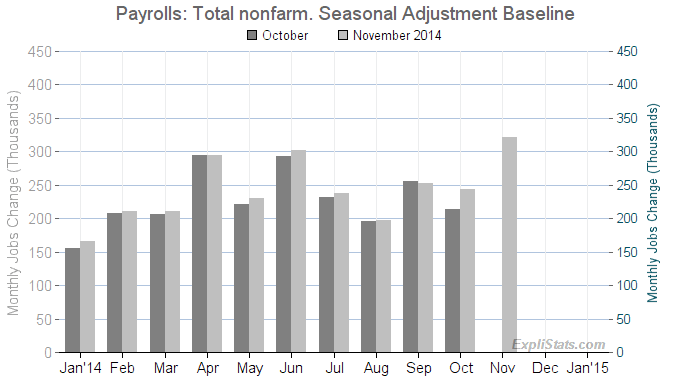
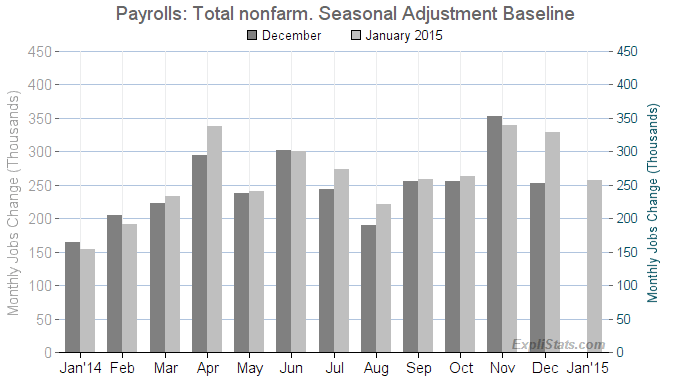
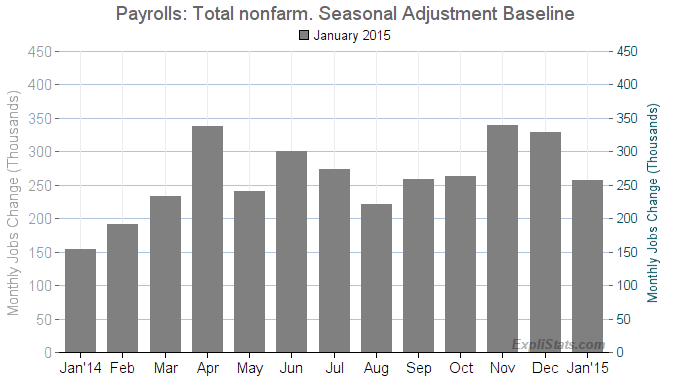
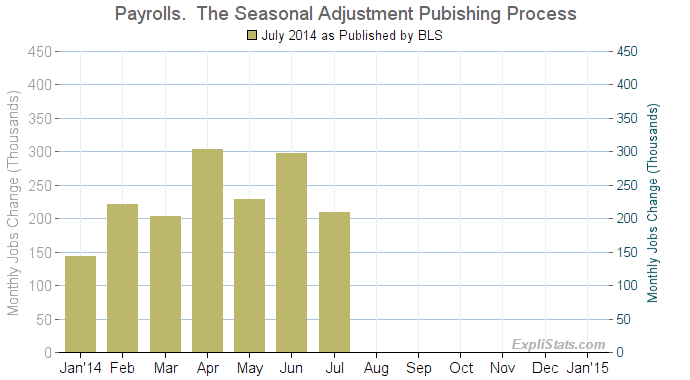
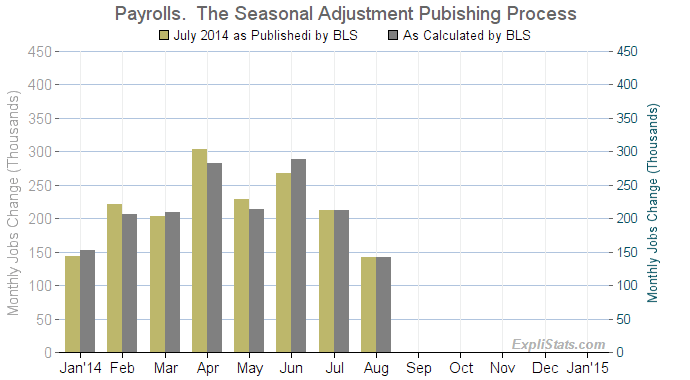
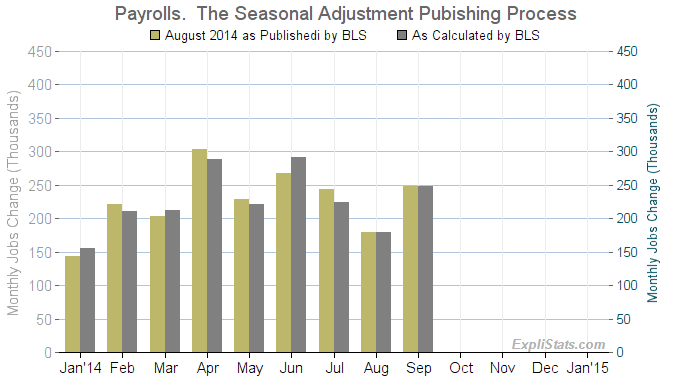
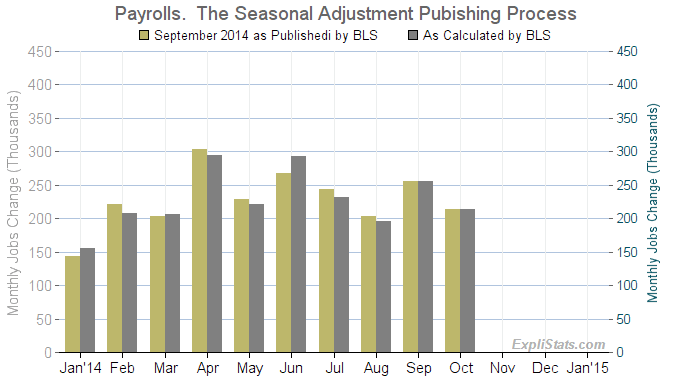
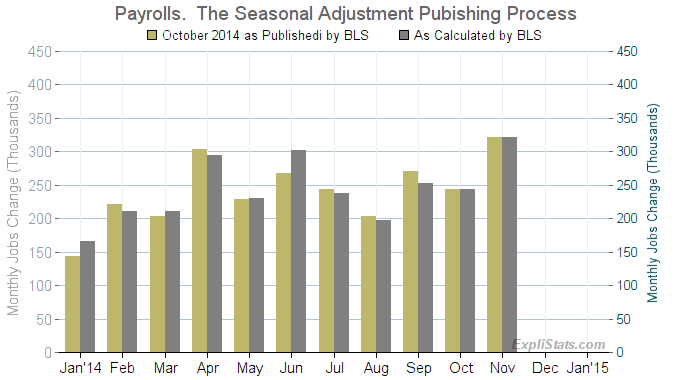
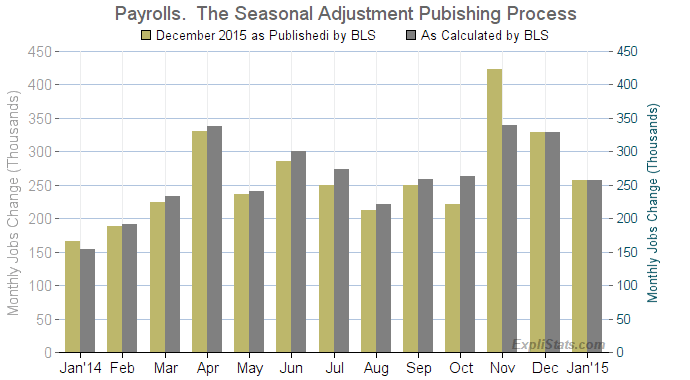
We show this process in the set of charts below. Note how each month the new release changes all of the prior months reported growth.
The Semi-Publication of the Actual Seasonal Adjustments
Now, rather bizarrely it might seem, each month when the BLS runs its ARIMA calculations, and obtains new seasonally adjusted numbers for the past five years, It does not publish the full set of numbers.
First of all, for the monthly levels it only publishes new numbers for the most recent three months.
This is because many years ago, before the current seasonal adjustment process was adopted, it made sense only to update the past three months, since the prior months were not revised by the old seasonal adjustment process.
So, the monthly published, total numbers of jobs (not shown in these charts) turns out to be a rolling set of numbers each from a different set of ARIMA calculation runs.
Why does this matter? The ARIMA runs are "holistic" looks at the past. When the BLS ran ARIMA in December, it redistributed the seasonality. If we do not look at the whole set of one ARIMA run, we are not getting a consistent, single redistribution.
The seasonal adjustment must even out over the year - on an annual growth basis, the change in jobs must tally between the adjusted and unadjusted levels. However, with each ARIMA run, the adjustments can be moved such that part of a past months published gain has been taken way and given to the latest month. Or vice versa. But in the BLS reports we will see the past month still with its gain (loss) and the new month with some of that gain (loss) having been given to it, but noted as taken from the past.
So, when we look at the published BLS growth numbers we are seeing a certain amount of double counting.
Now, it can be argued (and has been by the BLS) that this mathematical error is not too important in its effect because:
- The differences are small.
- The public are only interested in the last three months.
But, this is not the case. Plus, although the last few months are important, they need to be taken along with any downward and upward revisions to past growth which they bring with them. And then there is the matter of the third month back.
Now, to make matters worse the third-month-back's reported growth is a nonsense: Take the December release. The BLS published the revised October, November and December levels but (as above) reproduced a string of disjointed levels for prior months, each from different ARIMA solutions.
The BLS then takes the new, actual October level, and subtracts from it the unrevised September level (calculated during the previous month's ARIMA run), and publishes that hybrid difference as the "revised" October jobs gain.
Quite remarkable.
Annual Benchmark. One added complication. Come January, the BLS appears to produce a "reset" by publishing the revisions to ALL of the past months. However, there is a snag: From October through December, the BLS was limbering up by producing internal ARIMA runs on their developing benchmark. The results of those runs were not published. Until January.
The January benchmark as published is actually the conjoining of two different series. One, produced by an internal, benchmarked ARIMA run on December data, which yields the published level through October, and another the run with January's data whose revised levels are only published for November-January.
Again, the monthly move for the third month back, November is an artifact of subtracting from November's new, revised level, and old unrevised October level!
This year, that mathematical abnormality made the difference between a reported November jobs gain of 423,000 with a real, latest best estimate of 340,000. (See the last slide in the set of slides below.)
Note, in the charts above, how the latest two month's growth numbers are always an exact match between the published and the consistent, ARIMA numbers. Note also how once the three month wave has past, a month's published growth number (e.g. June) never changes, until the benchmark revision of January 2015.
How We Get the Actual Results
When the move to X-12-ARIMA was made (around 2004), the BLS made public its decision not to publish the full ARIMA results, together with a promise to provide the mechanics of the ARIMA process, if not the results, so that the public could reproduce the unpublished results.
Explistats availed itself of this offer, and of the very, full help of BLS CES (Payroll Survey) staff in replicating the process. This allows us to recalculate the full, internal BLS results (with some minor inaccuracies - due to non-publication of some unadjusted data by the BLS).
These are the data which are shown as "Actual" in the charts above.
For anyone who wants to understand how the last month's headline growth may have borrowed or lent from past months, or who wants to perform a consistent, time-series modelling of the payroll numbers, the actual ARIMA data is a necessity.
We are in the process of packaging the ARIMA data (down to the sub-industry level) as a new data product for our clients.
See also: The Purest Version of the BLS Seasonally-Adjusted Payroll Data.

