Much was made of the October Payrolls Survey’s headline growth figure of 271,000 in comparison with the growth rates for August and September of 153,000 and 137,000 respectively.
But relationship between these numbers needs to be viewed in the light of two major contributors to their value – seasonal adjustment and the revisions to the raw survey data.
Seasonal adjustment has a huge effect on the headline numbers, and their effect is adjusted every month (although you would not know it – see Consistent Payrolls).

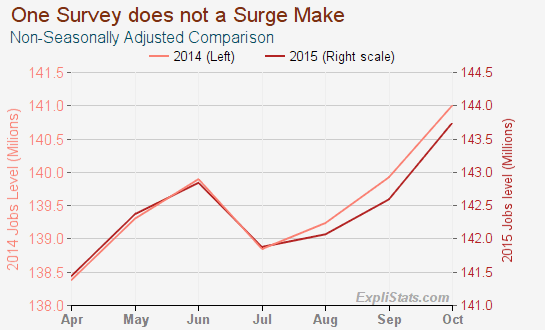
If we look at the chart above we see that the underlying, unadjusted jobs growth in the last few months has been pretty unexceptional compared to the same months last year.
And, bear in mind that the monthly data points are taken for one week in the middle of the month. What if employers were just a few days late this September, in getting back to hiring after the Labor Day break? That would have contributed to a low-ish 2015 September gain, and a high-ish October catch-up.
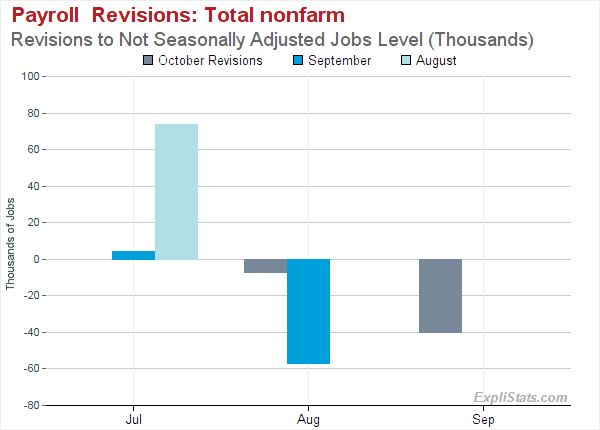
In addition, revisions to the underlying survey data have been rather large of late.
In the chart below we show that the August survey revised July (NSA) jobs up by 74,000, while the initially reported August level has subsequently been revised down by a total of 64,000 by the September and October revisions. September’s initial jobs estimate was revised down by 40,000 in October.
What kind of revisions might November have in store?

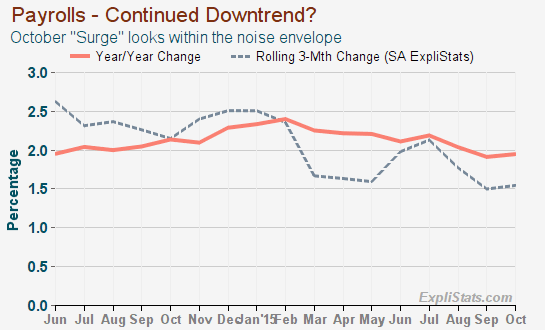
Overall, the seasonal-adjustment and revisions take their toll on any monthly signal in the headline numbers. We prefer to look at longer term measures like the year-to-year and the rolling 3-month change.
As can be seen In the chart below, both measures appear to have been in a downtrend since the beginning of 2015, and the turn upwards in October is slight compared both to the trend, and with prior upturns.

