The Census Bureau today released its June 2014 survey of International Trade.
The U.S. Trade deficit reduced by $3.1bn or 7% to a balance of -$41.6bn in June. This change came almost entirely from a net decrease in imports of $2.9bn.
| U.S. International Trade: Goods & Services (BoP). Seasonally Adjusted. |
|||||||||
|---|---|---|---|---|---|---|---|---|---|
| Expenditure Group | Level ($mill.) | Monthly Change ($mill.) | Mthly Chg (%) | Yr/Yr Change ($mill.) | Yr/Yr Chg (%) | ||||
| June 2014 |
Apr. 2014 |
May 2014 |
June 2014 |
June 2014 |
Apr. 2014 |
May 2014 |
June 2014 |
June 2014 |
|
| Trade Balance | -41,538 | -2,861 | 2,374 | 3,125 | -7.0 | -6,620 | 168 | -4,986 | 13.6 |
| Exports | 195,863 | -152 | 2,093 | 265 | 0.1 | 5,742 | 8,392 | 5,497 | 2.9 |
| Imports | 237,401 | 2,708 | -280 | -2,860 | -1.2 | 12,361 | 8,224 | 10,483 | 4.6 |
Click to enlarge
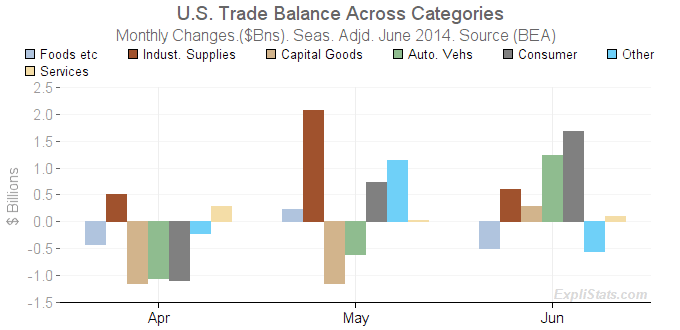
It will be seen that most of the improvement came from Auto Vehicles and Consumer goods, the latter seeing both an increase in exports and a decrease in imports. (See detail here on the Trade data and charts page.)
The deficit level for both these categories does, however, remain the largest components of the overall trade balance. See bar chart here on data and charts page.