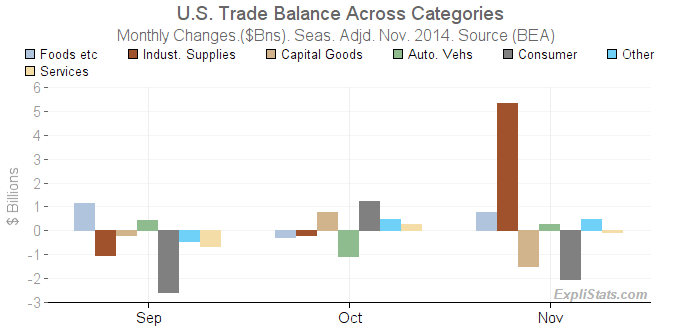
For more charts and tables at finer levels of detail, please visit our Latest International Trade Charts and Tables Page.
From the Census Bureau & B.E.A.’s report on November International Trade
The U.S. Census Bureau and the U.S. Bureau of Economic Analysis, through the Department of Commerce, announced today that the goods and services deficit was $39.0 billion in November, down $3.2 billion from $42.2 billion in October, revised. November exports were $196.4 billion, $2.0 billion less than October exports. November imports were $235.4 billion, $5.2 billion less than October imports.
| U.S. International Trade: Goods & Services (BoP). Seasonally Adjusted. | |||||||||
|---|---|---|---|---|---|---|---|---|---|
| Expenditure Group | Level ($mill.) | Monthly Change ($mill.) | Mthly Chg (%) | Yr/Yr Change ($mill.) | Yr/Yr Chg (%) | ||||
| Nov. 2014 | Sep. 2014 | Oct. 2014 | Nov. 2014 | Nov. 2014 | Sep. 2014 | Oct. 2014 | Nov. 2014 | Nov. 2014 | |
| Trade Balance | -39,001 | -3,572 | 1,354 | 3,248 | -7.7 | -1,340 | -3,166 | -3,029 | 8.4 |
| Exports | 196,357 | -3,504 | 3,089 | -1,964 | -1.0 | 4,983 | 4,350 | 1,435 | 0.7 |
| Imports | 235,359 | 68 | 1,735 | -5,211 | -2.2 | 6,323 | 7,517 | 4,465 | 1.9 |

Click to enlarge
This article was generated automatically from our database. We can automate custom reports, spreadsheets and data feeds for our clients. Please contact us with your requirements.
