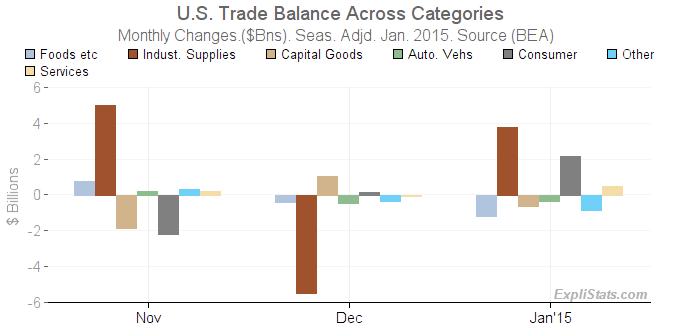
For more charts and tables at finer levels of detail, please visit our Latest International Trade Charts and Tables Page.
From the Census Bureau & B.E.A.’s report on January International Trade
The U.S. Census Bureau and the U.S. Bureau of Economic Analysis, through the Department of Commerce, announced today that the goods and services deficit was $41.8 billion in January, down $3.8 billion from $45.6 billion in December, revised. January exports were $189.4 billion, down $5.6 billion from December. January imports were $231.2 billion, down $9.4 billion from December.
| U.S. International Trade: Goods & Services (BoP). Seasonally Adjusted. | |||||||||
|---|---|---|---|---|---|---|---|---|---|
| Expenditure Group | Level ($mill.) | Monthly Change ($mill.) | Mthly Chg (%) | Yr/Yr Change ($mill.) | Yr/Yr Chg (%) | ||||
| Jan. 2015 | Nov. 2014 | Dec. 2014 | Jan. 2015 | Jan. 2015 | Nov. 2014 | Dec. 2014 | Jan. 2015 | Jan. 2015 | |
| Trade Balance | -41,752 | 2,369 | -6,072 | 3,849 | -8.4 | -3,557 | -8,208 | -2,911 | 7.5 |
| Exports | 189,410 | -1,921 | -1,790 | -5,592 | -2.9 | 1,870 | 2,203 | -3,337 | -1.7 |
| Imports | 231,162 | -4,291 | 4,283 | -9,441 | -3.9 | 5,426 | 10,410 | -426 | -0.2 |

Click to enlarge
More charts on Balance, Exports and Imports by Sector.)
This article was generated automatically from our database. We can automate custom reports, spreadsheets and data feeds for our clients. Please contact us with your requirements.
