Click to enlarge
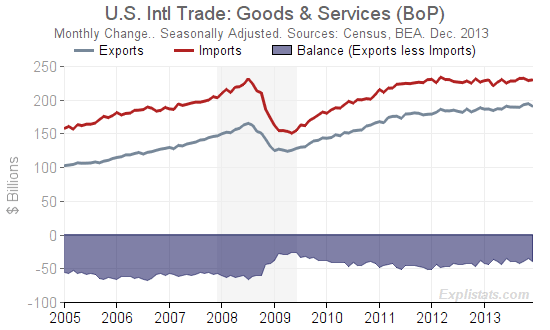
The U.S. Balance of Trade widened to a $38.7bn (annualized, seasonally-adjusted) level in December, the Bureau of Economic Analysis reported today. This worsening of $4.1bn almost completely reverses an improvement of $4.5bn in October (itself revised down from a previously reported $4.9bn).
Total Exports of Goods & Services dropped by $3.5bn while total Imports rose by $0.6bn. (See table below.)
The trade deficit is now almost unchanged over the past twelve months.
Significant moves occurred in:
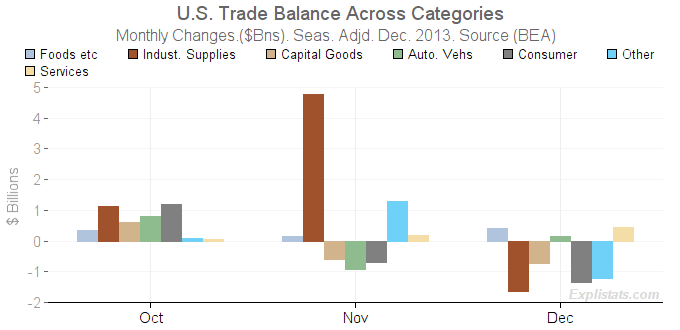
Industrial Supplies (including Crude and Petroleum products): Exports fell by $1.1bn, imports rose by $0.5bn.
Automotive Vehicle exports and imports both fell – by $0.8bn and $0.9bn respectively.
Capital Goods exports fell sharply by $1.1bn.
Consumer Goods exports fell by $0.7bn and imports rose by $0.7bn.
Numbers and charts for these and other sectors are available on our updated International Trade page.
| U.S. Interational Trade: Goods & Services (BoP). Seasonally Adjusted. |
|||||||||
|---|---|---|---|---|---|---|---|---|---|
| Expenditure Group | Level ($mill.) | Monthly Change ($mill.) | Mthly Chg (%) | Yr/Yr Change ($mill.) | Yr/Yr Chg (%) | ||||
| Dec. 2013 |
Oct. 2013 |
Nov. 2013 |
Dec. 2013 |
Dec. 2013 |
Oct. 2013 |
Nov. 2013 |
Dec. 2013 |
Dec. 2013 |
|
| Trade Balance | -38,701 | 3,641 | 4,515 | -4,143 | 12.0 | 3,577 | 11,864 | -394 | 1.0 |
| Exports | 191,287 | 3,824 | 1,463 | -3,509 | -1.8 | 10,678 | 9,576 | 2,601 | 1.4 |
| Imports | 229,988 | 183 | -3,052 | 634 | 0.3 | 7,102 | -2,287 | 2,994 | 1.3 |

Click to enlarge
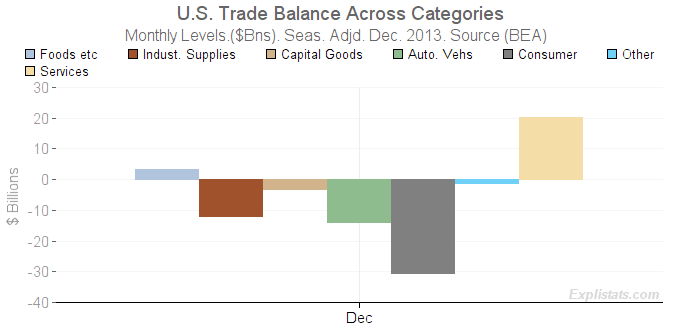
All categories remain in deficit, with the exception of Services and the sole Goods sector – Foods, Feeds & Beverages (second bar chart).
Note that the Monthly levels are at an annualized rate. A figure of -$30.5bn for Consumer Goods means that the U.S. is a net importer of such goods to the tune of around $1000 per year for every adult and child.

Click to enlarge
