Click to enlarge
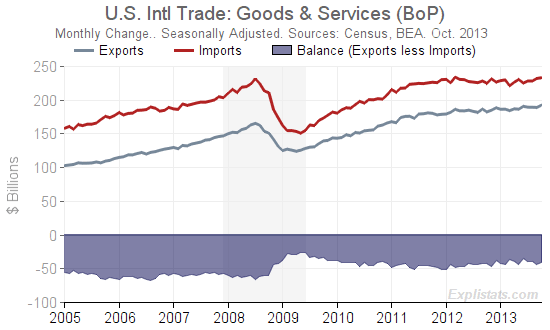
The U.S. Balance of Trade narrowed to a $40.6bn (annualized, seasonally-adjusted) level in October, the Bureau of Economic Analysis reported today. This represents an improvement of some $2.3bn compared with the (revised) September level.
The September level was, though, revised down by around $1bn from its previously reported level. This was due to September imports being revised upwards.
Total Exports of Goods & Services rose by $3.4bn while total Imports rose by only $1.0bn. (See table below.)
Significant moves occurred in:
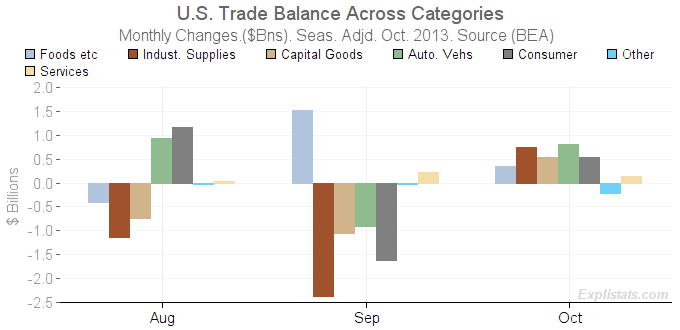
Industrial Supplies (including Crude and Petroleum products): Exports bounced back up by $1.5bn after dropping by $1.3bn in each of the previous two months.
Automotive Vehicle imports dropped back by $1.0bn after having risen by $0.9bn in September.
Consumer Goods exports rose by $1.0bn. Imports rose by only $0.5bn.
Numbers and charts for these and other sectors are available on our updated International Trade page.
The BEA will publish a more detailed breakdown of the figures on Friday, December 6th.
| U.S. Interational Trade: Goods & Services (BoP). Seasonally Adjusted. |
|||||||||
|---|---|---|---|---|---|---|---|---|---|
| Expenditure Group | Level ($mill.) | Monthly Change ($mill.) | Mthly Chg (%) | Yr/Yr Change ($mill.) | Yr/Yr Chg (%) | ||||
| Oct. 2013 |
Aug. 2013 |
Sep. 2013 |
Oct. 2013 |
Oct. 2013 |
Aug. 2013 |
Sep. 2013 |
Oct. 2013 |
Oct. 2013 |
|
| Trade Balance | -40,641 | -121 | -4,024 | 2,328 | -5.4 | 5,062 | -1,399 | 2,009 | -4.7 |
| Exports | 192,673 | -51 | -267 | 3,361 | 1.8 | 7,508 | 2,483 | 10,018 | 5.5 |
| Imports | 233,314 | 69 | 3,757 | 1,033 | 0.4 | 2,446 | 3,881 | 8,010 | 3.6 |

Click to enlarge
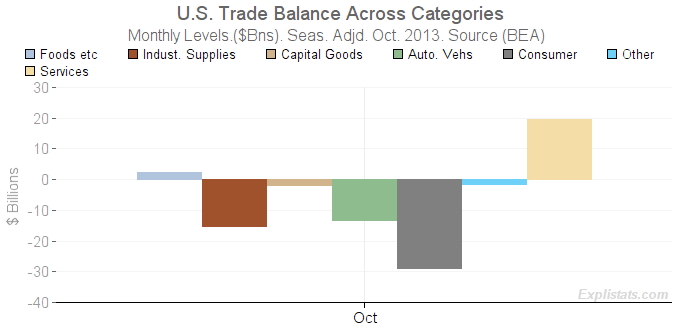
All categories still, though, remain in deficit, with the exception of Services and the sole Goods sector – Foods, Feeds & Beverages (second bar chart).

Click to enlarge
