Click to enlarge
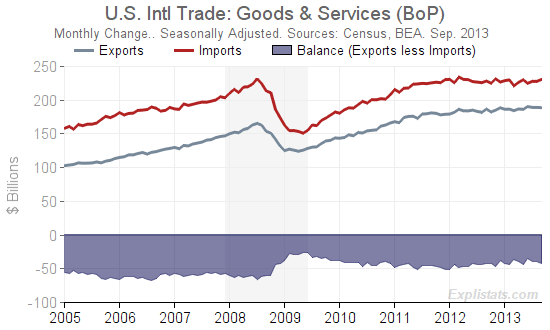
The U.S. Balance of Trade widened to a $41.8bn (annualized, seasonally-adjusted) level in September, the Bureau of Economic Analysis reported today. This represents a worsening of some $3.1bn compared with the (revised) August level.
Total Exports of Goods & Services fell by $0.4bn while total Imports rose by $2.7bn.
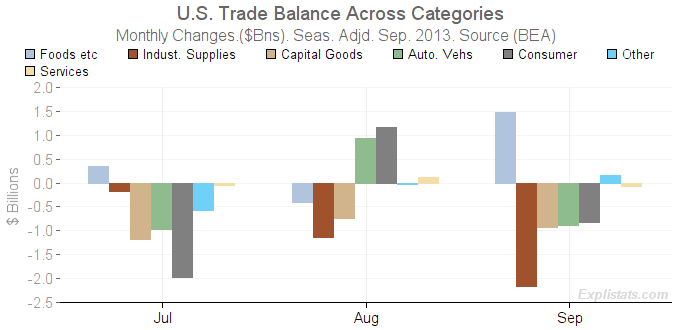
Significant moves occurred in: Crude Oil, where imports rose by just under $1bn to a level of $23.7bn; Fuel Oils where there is a slight net-surplus, saw a fall of almost 10% in exports of $0.6bn; Non-monetary gold exports (there are virtually no imports) fell by almost $0.7bn to $1.8bn.
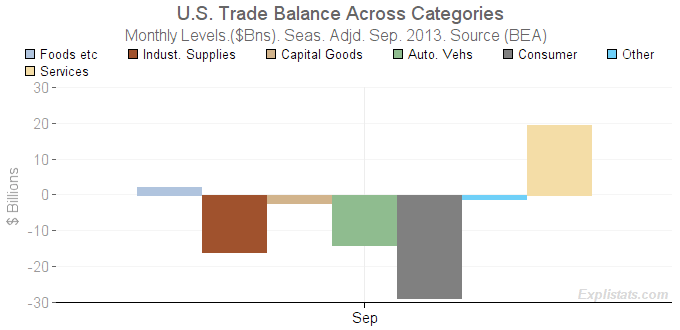
We hope, in a further post, to examine the recent trends in these and other components within the headline number. Meanwhile, the charts below show the breakdown of the trade balance across sectors. For more charts and tables please visit our updated International Trade page.
| U.S. Interational Trade: Goods & Services (BoP). Seasonally Adjusted. |
|||||||||
|---|---|---|---|---|---|---|---|---|---|
| Expenditure Group | Level ($Mns) | Mthly Change ($Mns) | Mthly Chg (%) | Yr/Yr Change ($Mns) | Yr/Yr Chg (%) | ||||
| Sep. 2013 |
July 2013 |
Aug. 2013 |
Sep. 2013 |
Sep. 2013 |
July 2013 |
Aug. 2013 |
Sep. 2013 |
Sep. 2013 |
|
| Trade Balance | -41,778 | -4,099 | -59 | -3,077 | 8.0 | 4,809 | 5,306 | -208 | 0.5 |
| Exports | 188,909 | -1,196 | -37 | -386 | -0.2 | 5,957 | 7,224 | 2,080 | 1.1 |
| Imports | 230,687 | 2,903 | 22 | 2,691 | 1.2 | 1,148 | 1,918 | 2,287 | 1.0 |
Click to enlarge
Click to enlarge