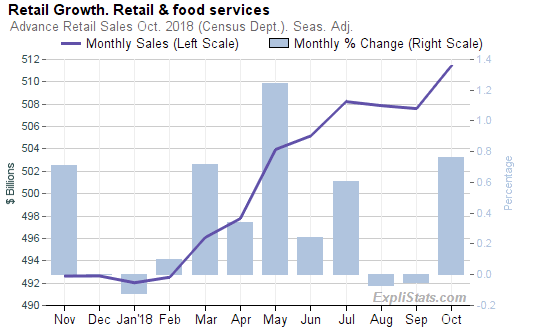
For more charts and tables at finer levels of detail, please visit our Latest Retail Sales Charts and Tables Page.

Click to enlarge
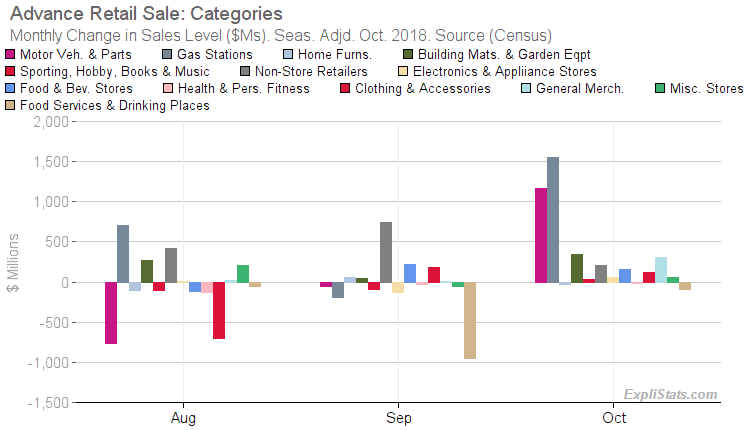
- Gasoline Stations sales rose by $1,549 billion (3.5%).
- Motor Vehicle & Parts Dealers sales rose by $1,169 billion (1.1%).
- Building Materials, Garden Eq. & Supply Dealers sales rose by $345 billion (1.0%).
- General Merchandise Stores sales rose by $309 billion (0.5%).

Click to enlarge

Click to enlarge
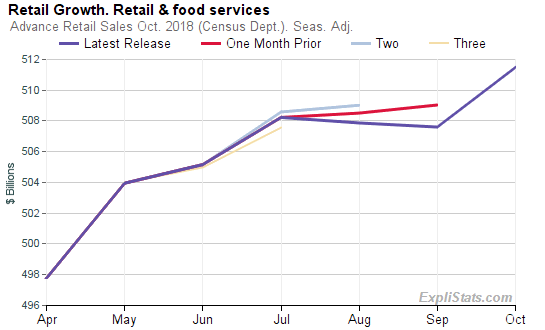
Revisions to Prior Months
Retail Sales for September were revised down by $793 billion , changing that month’s reported increase of 0.10% to a decrease of 0.05% . August sales were revised down by $642 billion , changing that month’s reported increase of 0.06% to a decrease of 0.07% .This article was generated automatically from our database. We can automate custom reports, spreadsheets and data feeds for our clients. Please contact us with your requirements.
