For more charts and tables at finer levels of detail, please visit our Latest Retail Sales Charts and Tables Page.
From the Census Department’s Retail Trade Report:
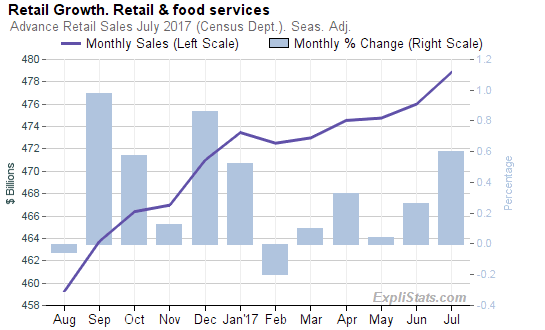
Release Number: CB17-130 August 15, 2017 — The U.S. Census Bureau announced the following advance estimates of U.S. retail and food services sales for July 2017: July 2017 June 2017 (revised) May Total June Auto Ex Auto $476.0 billion +0.3% $478.9 billion +0.6% 0.5 1 0 -0.5 ADVANCE MONTHLY SALES Percent Change in Retail and Food Services Sales from Previous Month Data adjusted for seasonal variation and holiday and trading-day differences but not for price changes. 1.5 Next release: September 15, 2017 * The 90 percent confidence interval includes zero. There is insufficient statistical evidence to conclude that the actual change is different from zero. Data adjusted for seasonal variation and holiday and trading-day differences but not for price changes. Source: U.S. Census Bureau, Advanced Monthly Retail Trade Survey, August 15, 2017. Advance Estimates of U.S. Retail and Food Services Advance estimates of U.S. retail and food services sales for July 2017, adjusted for seasonal variation and holiday and trading-day differences, but not for price changes, were $478.9 billion, an increase of 0.6 percent (± 0.5 percent) from the previous month, and 4.2 percent (± 0.9 percent) above July 2016. Total sales for the May 2017 through July 2017 period were up 3.9 percent (± 0.7 percent) from the same period a year ago. The May 2017 to June 2017 percent change was revised from down 0.2 percent (± 0.5 percent)* to up 0.3 percent (± 0.2 percent). Retail trade sales were up 0.6 percent (± 0.5 percent) from June 2017, and up 4.3 percent (± 0.7 percent) from last year. Nonstore Retailers were up 11.5 percent (± 1.8 percent) from July 2016, while Building Materials and Garden Equipment and Supplies Dealers were up 8.3 percent (± 1.9 percent) from last year. General Information The August 2017 Advance Monthly Retail report is scheduled for release on September 15, 2017 at 8:30 a.m. EDT. View the full schedule in the Economic Briefing Room: <www.census.gov/economic- indicators/>. The full text and tables of this release can be found at <www.census.gov/retail/>. Source: U.S. Census Bureau,

Click to enlarge
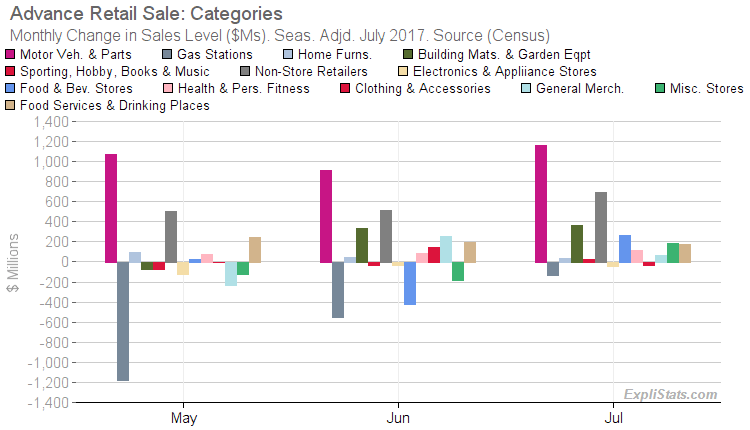
- Motor Vehicle & Parts Dealers sales rose by $1,160 billion (1.2%).
- Nonstore Retailers sales rose by $696 billion (1.3%).
- Building Materials, Garden Eq. & Supply Dealers sales rose by $359 billion (1.2%).
- Food & Beverage Stores sales rose by $266 billion (0.4%).

Click to enlarge

Click to enlarge
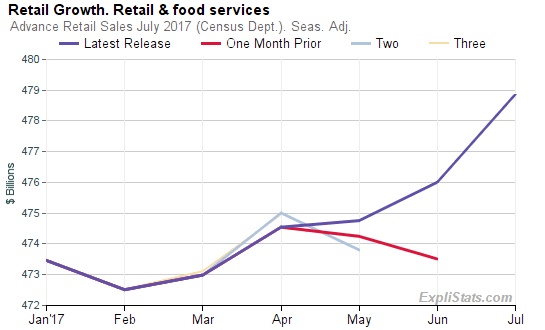
Revisions to Prior Months
Retail Sales for June were revised up by $1,985 billion , changing that month’s reported decrease of 0.16% to an increase of 0.26%. May sales were revised up by $511 billion , changing that month’s reported decrease of 0.06% to an increase of 0.04% .This article was generated automatically from our database. We can automate custom reports, spreadsheets and data feeds for our clients. Please contact us with your requirements.
