Click to enlarge
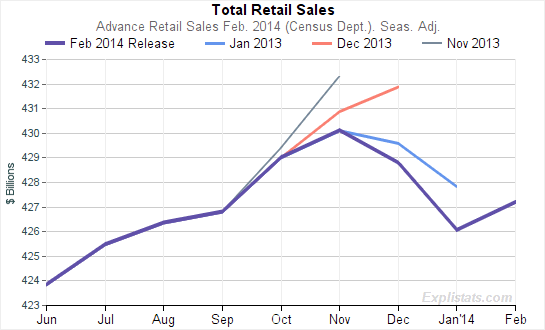
Downward revisions continue. With each release, the prior two months numbers are revised. The chart to the right shows the sales numbers as published at the time of each of the past four releases.
You will notice that today’s figure (heavy black line “Feb 2014 Release”) for January has been revised down, and that without that revision, today’s number for February sales would record a drop in sales from last month’s January figure.
Note also, that the first reported estimate for November 2013 sales, came out at $432.3 bn. Today’s figure for February is 1.2% below that, at $427.2 bn.
 Click to enlarge |
 Click to enlarge |
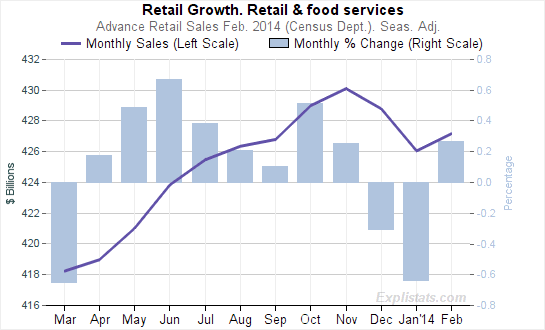
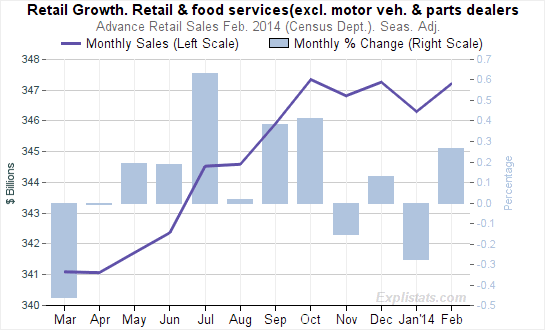
For more numbers and charts based on today’s release, visit the Retail Sales Dataset page.
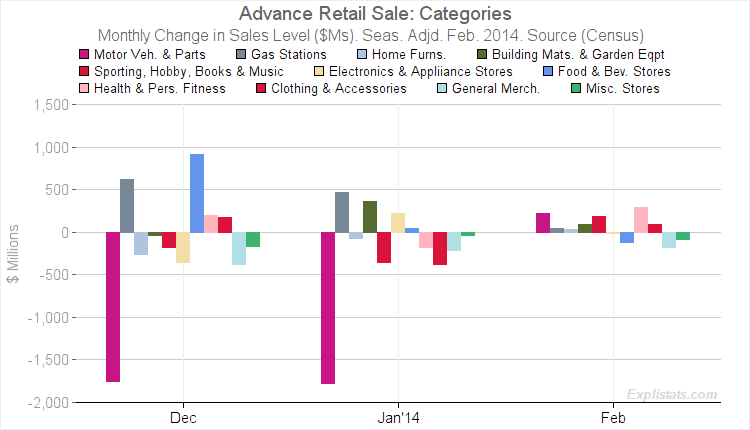
The chart below shows the distribution of sales growth across different categories for the past three months. Changes in all categories were relatively muted – a very non-volatile set of monthly changes.

Click to enlarge
