For more charts and tables at finer levels of detail, please visit our Latest Retail Sales Charts and Tables Page.

Click to enlarge
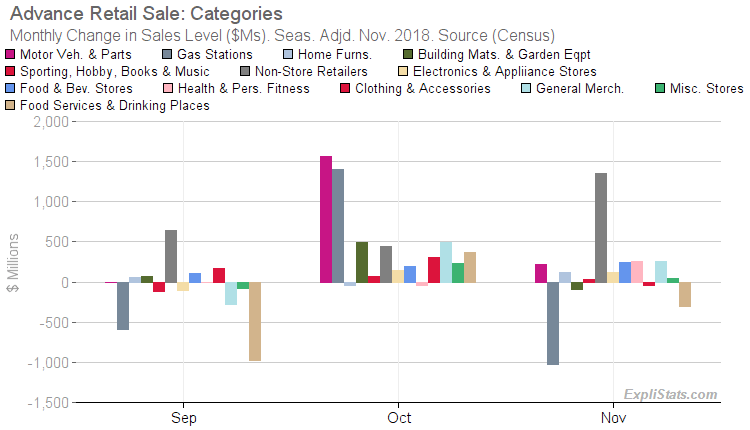
- Nonstore Retailers sales rose by $1,351 billion (2.3%).
- Gasoline Stations sales fell by $1,021 billion (-2.3%).
- Food Services & Drinking Places sales fell by $300 billion (-0.5%).
- General Merchandise Stores sales rose by $257 billion (0.4%).

Click to enlarge

Click to enlarge
Revisions to Prior Months
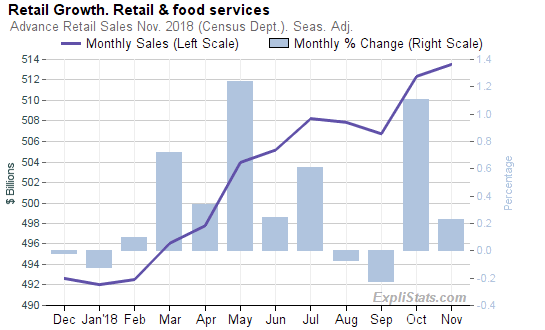
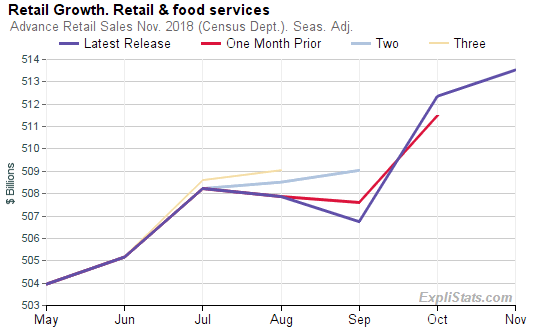
Retail Sales for October were revised up by $1,725 billion , changing that month’s reported increase of 0.76% to an increase of 1.11% . September sales were revised down by $857 billion , changing that month’s reported decrease of 0.05% to a decrease of 0.22% .This article was generated automatically from our database. We can automate custom reports, spreadsheets and data feeds for our clients. Please contact us with your requirements.
