For more charts and tables at finer levels of detail, please visit our Latest Retail Sales Charts and Tables Page.
From the Census Department’s Retail Trade Report:
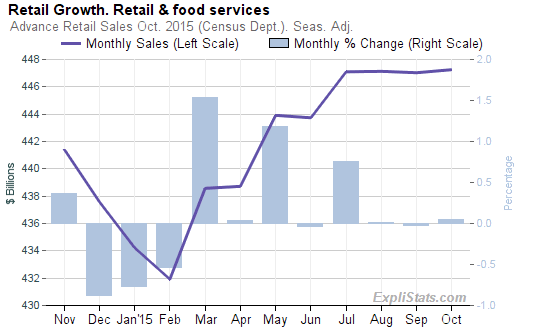
The U.S. Census Bureau announced today that advance estimates of U.S. retail and food services sales for October, adjusted for seasonal variation and holiday and trading-day differences, but not for price changes, were $447.3 billion, an increase of 0.1 percent (±0.5%)* from the previous month, and 1.7 percent (±0.7%) above October 2014. Total sales for the August 2015 through October 2015 period were up 2.0 percent (±0.5%) from the same period a year ago.

Click to enlarge
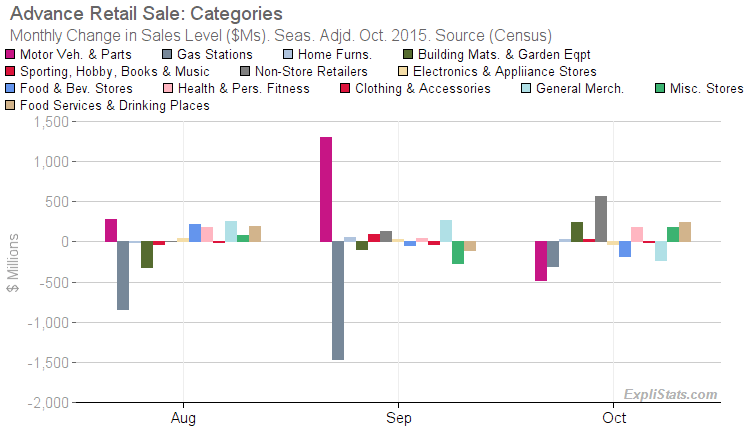
- Nonstore Retailers sales rose by $570 billion (1.4%).
- Motor Vehicle & Parts Dealers sales fell by $476 billion (-0.5%).
- Gasoline Stations sales fell by $309 billion (-0.9%).
- Food Services & Drinking Places sales rose by $240 billion (0.5%).

Click to enlarge

Click to enlarge
Revisions to Prior Months
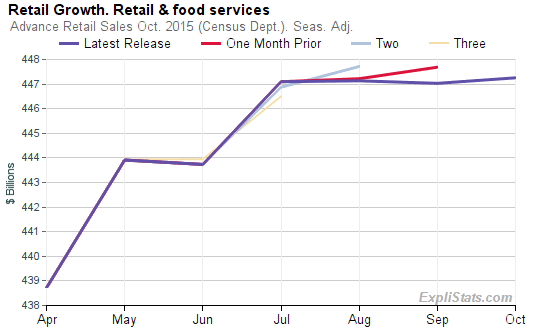
Retail Sales for September were revised down by $569 billion , changing that month’s reported increase of 0.10% to a decrease of 0.02% . August sales were revised but not significantly, down by $86 billion .This article was generated automatically from our database. We can automate custom reports, spreadsheets and data feeds for our clients. Please contact us with your requirements.
