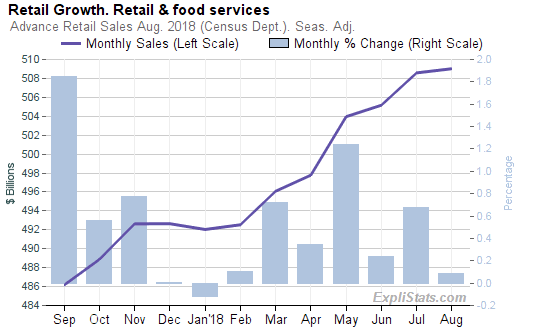
For more charts and tables at finer levels of detail, please visit our Latest Retail Sales Charts and Tables Page.

Click to enlarge
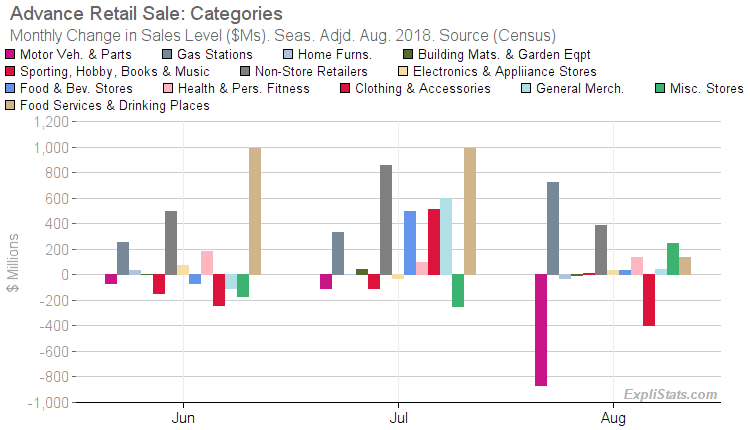
- Motor Vehicle & Parts Dealers sales fell by $865 billion (-0.8%).
- Gasoline Stations sales rose by $722 billion (1.7%).
- Clothing & Clothing Accessories Stores sales fell by $398 billion (-1.7%).
- Nonstore Retailers sales rose by $389 billion (0.7%).

Click to enlarge

Click to enlarge
Revisions to Prior Months
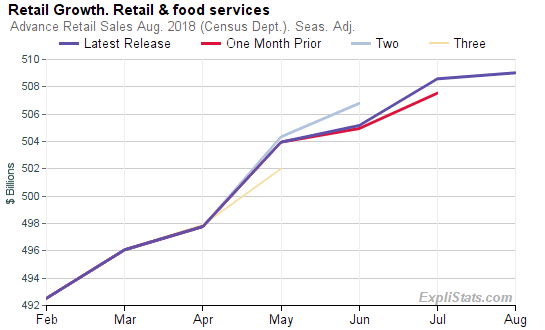
Retail Sales for July were revised up by $832 billion , changing that month’s reported increase of 0.51% to an increase of 0.68% . June sales were revised up by $220 billion , changing that month’s reported increase of 0.20% to an increase of 0.24% .This article was generated automatically from our database. We can automate custom reports, spreadsheets and data feeds for our clients. Please contact us with your requirements.
