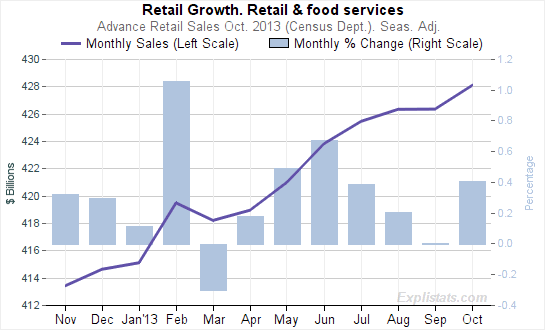
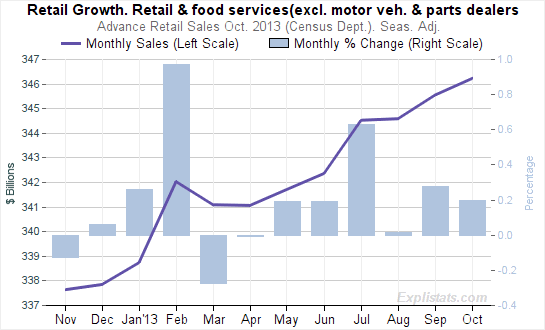
October’s retail sales were today reported by the Census Department as having risen by $1,730M or 0.4% compared with the (revised) September figure.
This figure was once again swamped by the volatile, single category of Motor Vehicle & Parts Dealers, which rose by $1,056M, having dropped by $948M in September, and risen in August by $792M.
The two charts to the right plot the total Retail Sales with and without the contribution of vehicle sales. The volatility in Vehicle sales series is particularly high in August through October probably due to the seasonal adjustment model struggling with the timing of the new model-year sales.
 Click to enlarge |
 Click to enlarge |
All other categories grew with the exception of Gasoline Stations (where the CPI report today tells us prices dropped by 10%) and in Building Materials & Garden Supplies.
The charts below shows the distribution of sales growth across different categories for the past three months. As can be seen, the Motor Vehicle & Parts category dominates.

Click to enlarge