From the Census Department’s Retail Trade Report:
Intention to Revise Retail Estimates: Monthly retail sales estimates will be revised based on the results of the 2013 Annual Retail Trade Survey and the preliminary results from the 2012 Economic Census. Revised not adjusted estimates and corresponding adjusted estimates are scheduled for release on April 30, 2015 at 10:00 a.m. EDT.
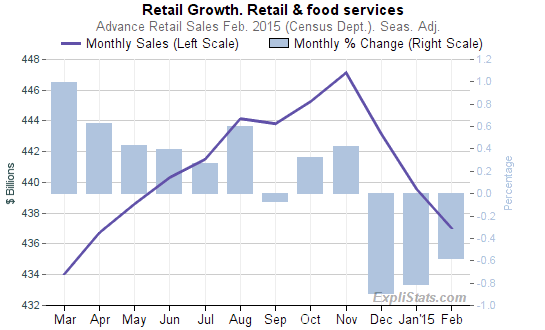
The U.S. Census Bureau announced today that advance estimates of U.S. retail and food services sales for February, adjusted for seasonal variation and holiday and trading-day differences, but not for price changes, were $437.0 billion, a decrease of 0.6 percent (±0.5%) from the previous month, but up 1.7 percent (±0.9%) above February 2014. Total sales for the December 2014 through February 2015 period were up 2.9 percent (±0.7%) from the same period a year ago. The December 2014 to January 2015 percent change was unrevised from -0.8 percent (±0.3%).
Retail trade sales were down 0.6 (±0.5%) from January 2015, but up 1.0 percent (±0.9%) above last year. Nonstore retailers were up 8.6 (±2.1%) from February 2014 and food services and drinking places were up 7.7 percent (±3.5%) from last year. Gasoline stations were down 23.0 percent (±1.6%) from the previous year.

Click to enlarge
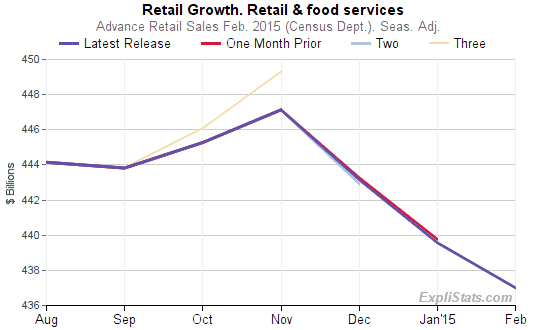
Revisions to the prior two month’s reporting were not signifiant.
See below.
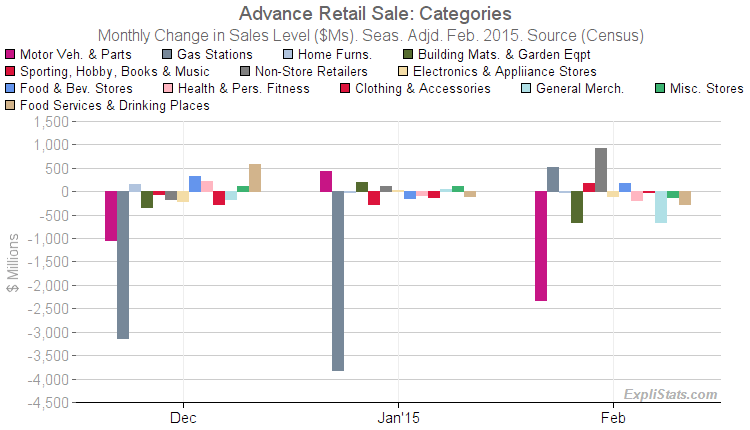
Total sales volume fell by $2,566 billion
, with the biggest contributors being:
- Motor Vehicle & Parts Dealers sales fell by $2,316 billion
(-2.5%). - Nonstore Retailers sales rose by $920 billion
(2.2%). - Building Materials, Garden Eq. & Supply Dealers sales fell by $656 billion
(-2.3%). - General Merchandise Stores sales fell by $648 billion
(-1.2%).
These are shown graphically in the bar chart below.

Click to enlarge

Click to enlarge
Revisions to Prior Months
Retail Sales for January were
revised but not significantly, down by $81 billion .
December sales were revised but not significantly, down by $118 billion .
