Click to enlarge
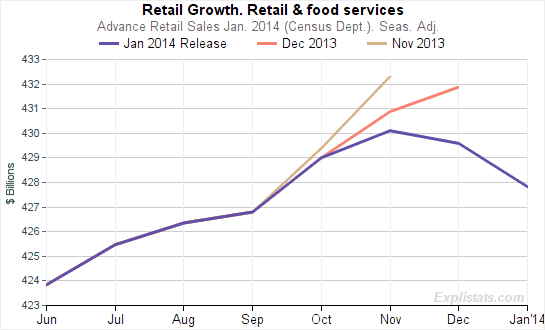
Downward revisions continue with today’s November sales figure now over $2bn less than initially reported.
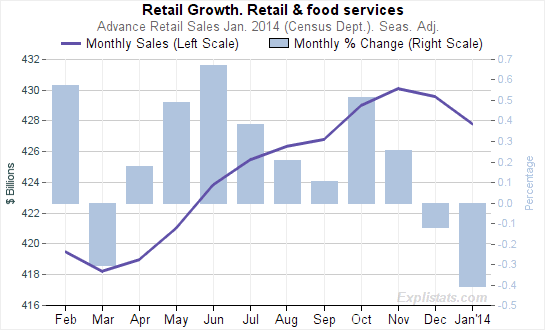
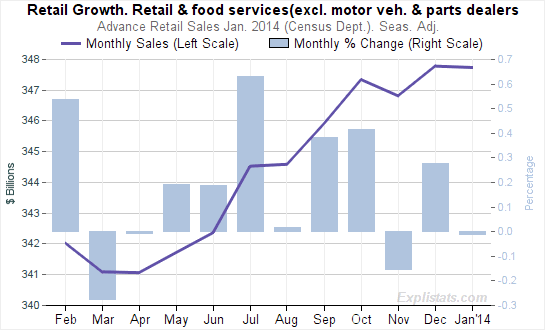
Total sales showing a peak in November now, although exluding the volatile Vehicle Sales we see a different pattern (below, chart on right.)
 Click to enlarge |
 Click to enlarge |
For more numbers and charts based on today’s release, visit the Retail Sales Dataset page.
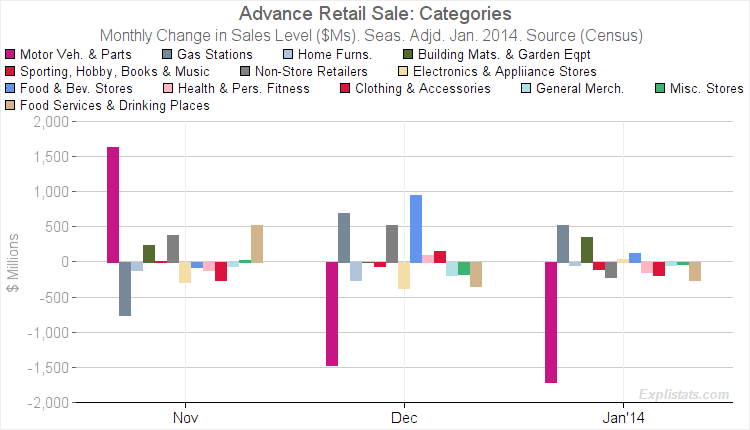
The chart below shows the distribution of sales growth across different categories for the past three months. As can be seen, the Motor Vehicle & Parts category dominates.

Click to enlarge
