From the Census Department’s Retail Trade Report:
Notice of Revision: Monthly retail sales estimates were revised on April 30, 2015 based on the results of the 2013 Annual Retail Trade Survey and the preliminary results from the 2012 Economic Census . The Annual Revision of Monthly Retail and Food Services showing revised estimates can be found on our website at http://www.census.gov/retail/mrts/www/benchmark/2015/html/annrev15.html.
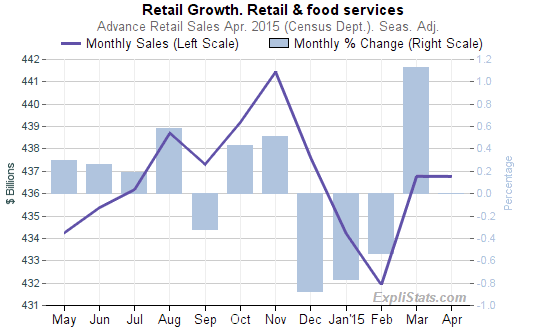
The U.S. Census Bureau announced today that advance estimates of U.S. retail and food services sales for April, adjusted for seasonal variation and holiday and trading-day differences, but not for price changes, were $436.8 billion, virtually unchanged (±0.5%)* from the previous month, but 0.9 percent (±0.9%)* above April 2014. Total sales for the February 2015 through April 2015 period were up 1.5 percent (±0.7%) from the same period a year ago. The February 2015 to March 2015 percent change was revised from +0.9 percent (±0.5%) to +1.1 percent (±0.2%).
Retail trade sales were down 0.1 (±0.5%)* from March 2015, and 0.1 percent (±0.7%)* below last year. Food services and drinking places were up 8.5 percent (±3.3%) from April 2014 and nonstore retailers were up 6.3 percent (±1.9%) from last year.
Click to enlarge
Revisions to the prior two month’s reporting included a change of 0.26% for March , and a change of -0.07% for February .
See below.
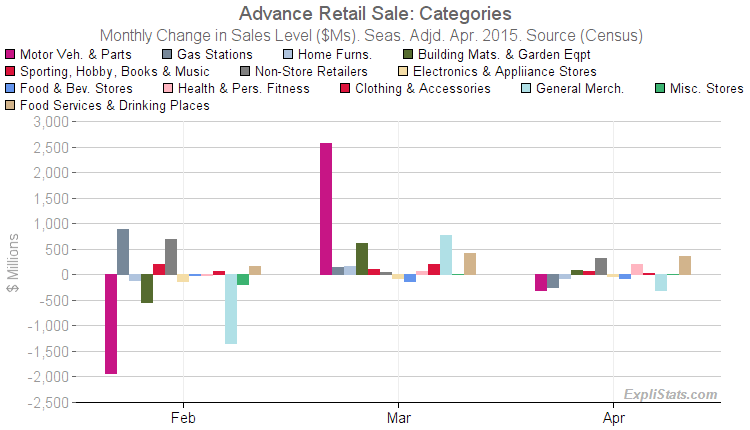
Total sales volume fell by $4 billion
, with the biggest contributors being:
- Food Services & Drinking Places sales rose by $354 billion
(0.7%). - Nonstore Retailers sales rose by $324 billion
(0.8%). - Motor Vehicle & Parts Dealers sales fell by $316 billion
(-0.4%). - General Merchandise Stores sales fell by $300 billion
(-0.5%).
These are shown graphically in the bar chart below.
Click to enlarge
Click to enlarge
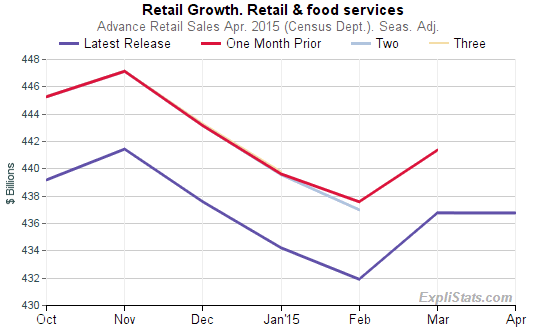
Revisions to Prior Months
Retail Sales for March were
revised up by $1,082 billion , changing that month’s reported increase of 0.86% to an increase of 1.12% .
February sales were revised down by $265 billion , changing that month’s reported decrease of 0.46% to a decrease of 0.53% .