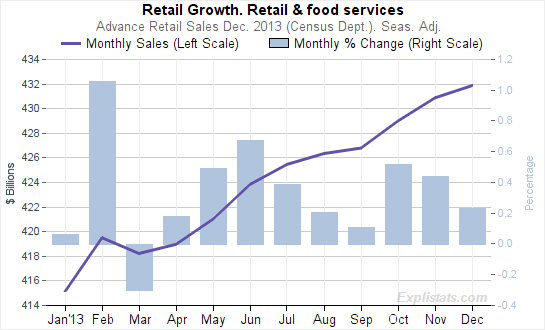
December’s retail sales were today reported by the Census Department as having risen by $998M or 0.2% on a seasonally-adjusted basis, compared with the (revised) November figure.
However, due to revisions, the total sales estimate for December is now less than had been first estimated for November – $431.bn and $432.3bn respectively) The November sales growth was revised sharply downward by a third: Last month’s Advance Report estimated an increase of $2.9bn but it is now estimated to be only $1.9b. Building Materials and Non-Store Retailing suffered heavy downward revisions to their growth in November.
For more numbers and charts based on today’s release, visit the Retail Sales Dataset page.
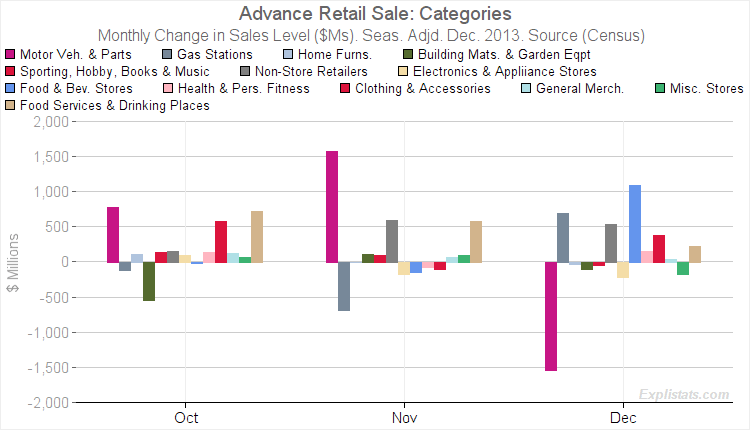
December saw a continuation of a major contribution from the volatile Motor Vehicles sector – this month a negative one.
The chart below shows the distribution of sales growth across different categories for the past three months. As can be seen, the Motor Vehicle & Parts category dominates, although in December Food & Beverage Stores did well – even after seasonal adjustment: The sector’s growth was estimated at 2%, a figure not seen since 2006.

Click to enlarge
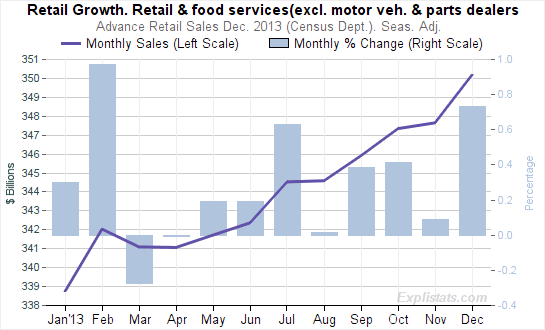
Retail sales excluding Motor Vehicles previously steady growth of 0.4% – 0.5% per month, is now more volatile, with gains of 0.4%, 0.1% and 0.7% in the past three consecutive months.
 |
 |
