Housing Starts in January down 16% from December, Single Family homes down 7% year over year
| U.S. Residential Construction: Housing Starts, Nationally Housing Units, Annualized Rate (Thousands) Seasonally Adjusted |
||||||||||
|---|---|---|---|---|---|---|---|---|---|---|
| Structure Type | Monthly Level (SA) | Monthly % Change | Year/Year % Change | |||||||
| Jan. 2013 |
Nov. 2013 |
Dec. 2013 |
Jan. 2014 |
Nov. 2013 |
Dec. 2013 |
Jan. 2014 |
Nov. 2013 |
Dec. 2013 |
Jan. 2014 |
|
| All Types | 898 | 1,101 | 1,048 | 880 | 22.5 | -4.8 | -16.0 | 30.8 | 6.6 | -2.0 |
| Single Family Homes | 614 | 713 | 681 | 573 | 18.8 | -4.5 | -15.9 | 23.8 | 9.8 | -6.7 |
| Multi-Unit Buildings | 284 | 388 | 367 | 307 | 29.8 | -5.4 | -16.3 | 45.9 | 1.1 | 8.1 |
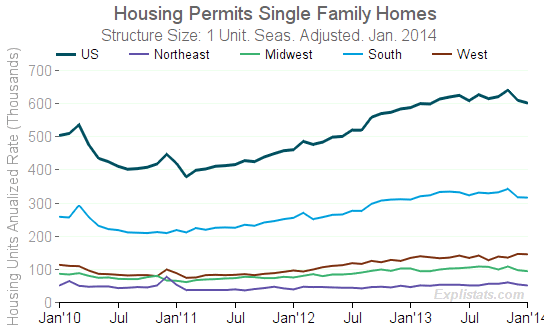
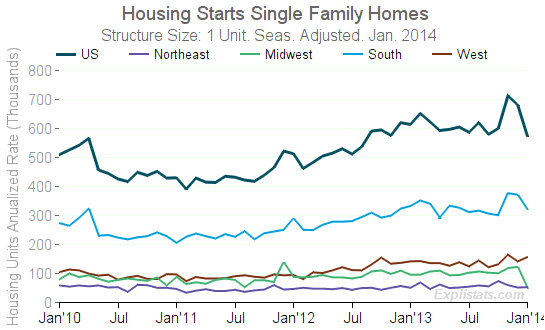
Single-Family Permits and Starts are down two months in a row. See the Data Set page for more tables and charts.
But the West continues to grow. Severe winter weather in all other regions may have caused the drop elsewhere. Compare the West region with all others in the charts below. (Click to enlarge)

Click to enlarge

Click to enlarge
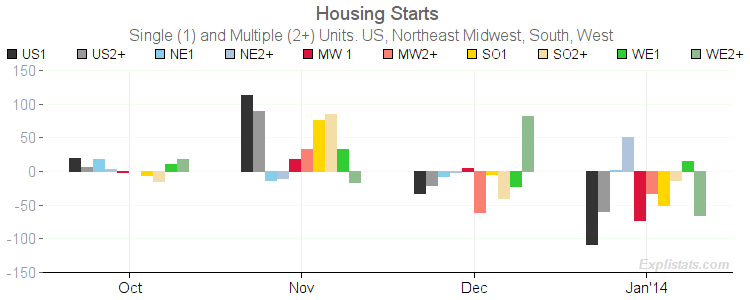
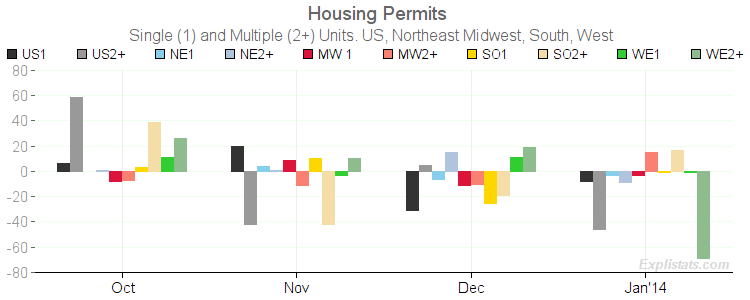
Changes to permits and starts by region and building size:

Click to enlarge

