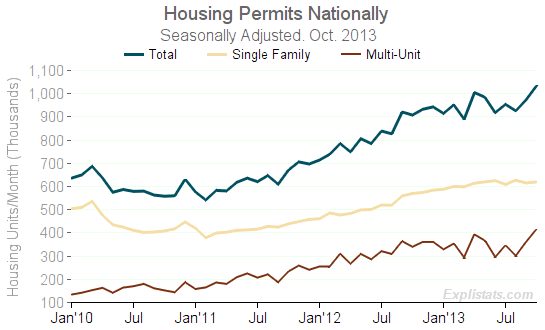
The Census Department today published the delayed survey on September and October residential construction permits. The data on housing starts was further delayed until December 18th.

Click to enlarge

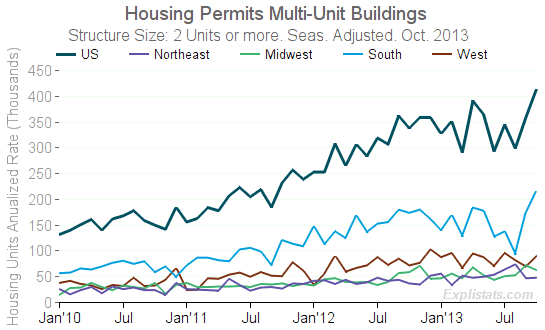
Click to enlarge
However, almost all of this growth is attributable to apartment-building permits in the South region. See charts.
Single-family home permits were essentially flat over September and October with a drop of 1.9% being followed by a gain of 0.8%.
On a rolling three-month view, single-home permits are up 0.4% in August-October 2013 compared with the same months in 2012. The corresponding growth in multi-unit structures was 6.9%, for an overall total growth in permits of 2.7%.
We hope to analyze the detailed permits data, by metro-area to see where the multi-unit permit issuance might be concentrated. As we have seen with Manhattan tower-blocks in the past, wo or three high-rise condominiums in one month can give a large kick to the annualized, national rate.
| U.S. Residential Construction: Housing Permits, Nationally Housing Units, Annualized Rate (Thousands) Seasonally Adjusted |
||||||||||
|---|---|---|---|---|---|---|---|---|---|---|
| Structure Type | Monthly Level (SA) | Monthly % Change | Year/Year % Change | |||||||
| Oct. 2012 |
Aug. 2013 |
Sep. 2013 |
Oct. 2013 |
Aug. 2013 |
Sep. 2013 |
Oct. 2013 |
Aug. 2013 |
Sep. 2013 |
Oct. 2013 |
|
| All Types | 908 | 926 | 974 | 1,034 | -2.9 | 5.2 | 6.2 | 12.0 | 5.8 | 13.9 |
| Single Family Homes | 570 | 627 | 615 | 620 | 3.0 | -1.9 | 0.8 | 20.6 | 10.0 | 8.8 |
| Multi-Unit Buildings | 338 | 299 | 359 | 414 | -13.3 | 20.1 | 15.3 | -2.6 | -0.8 | 22.5 |
