The Census Bureau reported this morning on the December Residential Construction survey,
Housing starts fell by 9.8% in December at an annualized seasonally adjusted rate, after having risen by 23.1% in November. (November’s gains had previously been estimated at 22.7%.)
| U.S. Residential Construction: Housing Starts, Nationally Housing Units, Annualized Rate (Thousands) Seasonally Adjusted |
||||||||||
|---|---|---|---|---|---|---|---|---|---|---|
| Structure Type | Monthly Level (SA) | Monthly % Change | Year/Year % Change | |||||||
| Dec. 2012 |
Oct. 2013 |
Nov. 2013 |
Dec. 2013 |
Oct. 2013 |
Nov. 2013 |
Dec. 2013 |
Oct. 2013 |
Nov. 2013 |
Dec. 2013 |
|
| All Types | 983 | 899 | 1,107 | 999 | 3.0 | 23.1 | -9.8 | 4.1 | 31.5 | 1.6 |
| Single Family Homes | 620 | 600 | 717 | 667 | 3.4 | 19.5 | -7.0 | 0.8 | 24.5 | 7.6 |
| Multi-Unit Buildings | 363 | 299 | 390 | 332 | 2.0 | 30.4 | -14.9 | 11.2 | 46.6 | -8.5 |
See the Residential Construction Dataset Page for more details.
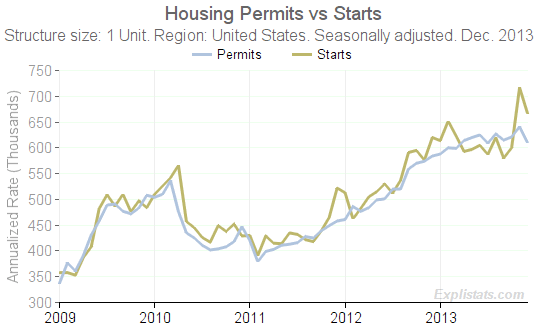
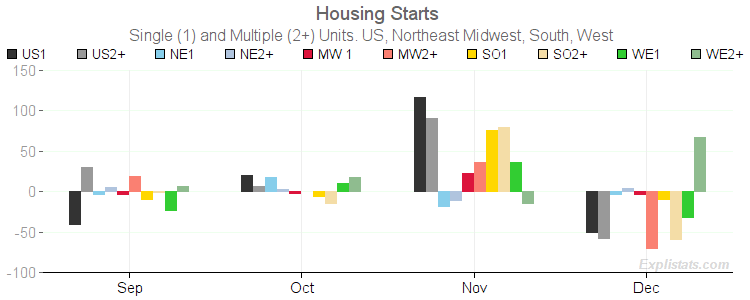
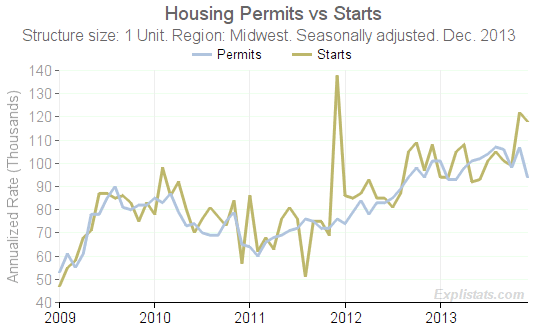
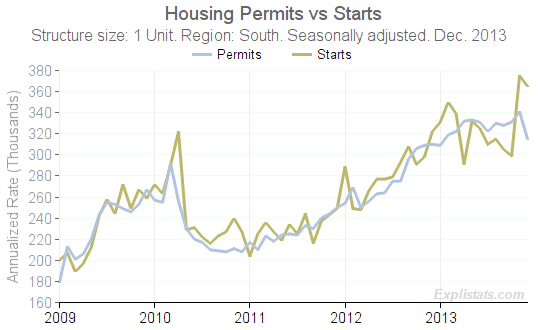
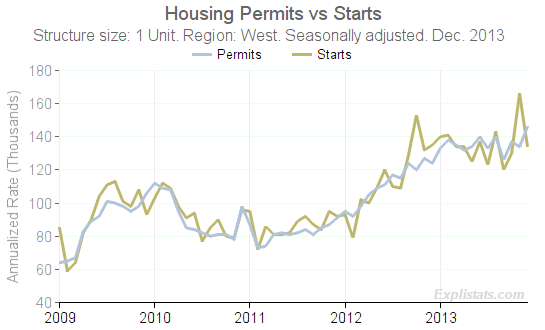
Starts usually track Permit activity for single family homes, and starts over-shot permits by a large amount in November. We now see some dropping back in December.
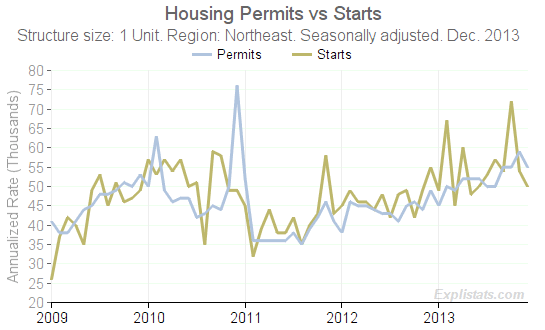
Last month. looking across regions, we see the same pattern of a spike in single-family homes vs permits happening in all but the North East region. This month, the West region’s spike has now reversed in December.
Notice how in the other two regions, South and Midwest, single-family permits fell sharply in December.
 Click to enlarge |
 Click to enlarge |
 Click to enlarge |
 Click to enlarge |
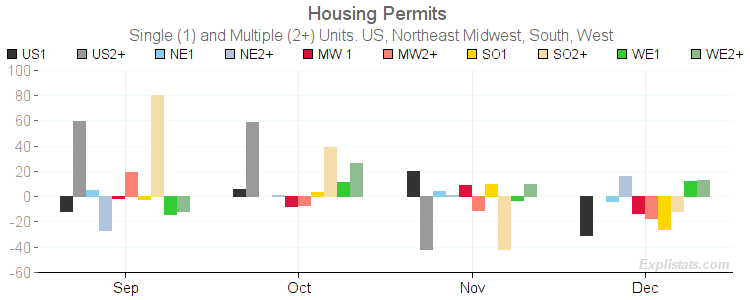
The charts below show the distribution of changes across building size and region for Permits and Starts. Note the subdued Permit authorizations in the past four months for Single Family homes. Note also that the national Permit rate continues to be dominated by the volatile rate for apartment buildings in the South region.