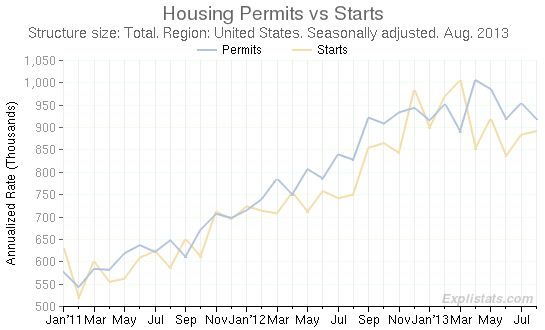
Residential Constructon survey: Housing starts rose 0.9% in August. More or less flat – see first chart below. Month to month changes are often volatile. The Census Bureau advises that trends take some time to establish themselves:
“In interpreting changes in the statistics in this release, note that month-to-month changes in seasonally adjusted statistics often show movements which may be irregular. It may take 3 months to establish an underlying trend for building permit authorizations, 4 months for total starts, and 6 months for total completions.” – Census Bureau.
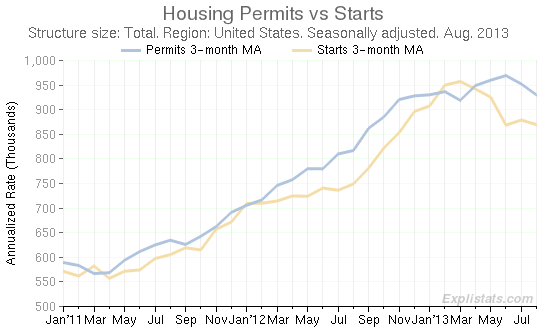
With this in mind we compare, the monthly (first chart) and the three-month average (second) of both permits and starts.

Click to enlarge

Click to enlarge
From the second chart, housing starts do seem to have made a recent peak, while permits are still on an up-trend, though diminished.
For the past three-month period (June-August) starts are up 16.1% compared with the same period a year ago (seasonally adjusted). Permits are up 13.8% over the same comparison periods. However, on a quarter-to-quarter basis, the past three month period saw a decrease in starts of 6.0% and a decrease in permits of 3.1% over the prior three-month period (March-June). All of these figures and more can be obtained from the tables on the updated Residential Construction page.
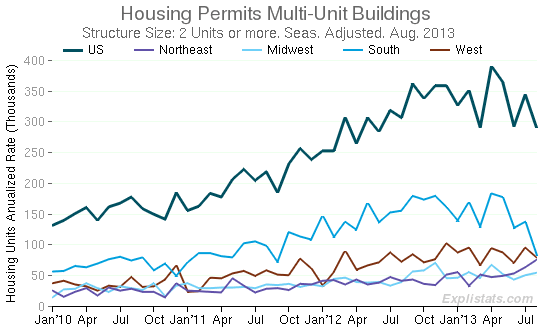
The real drop over recent months has been in multi-unit housing: Three-month multi-unit starts are down 18.1% compared with the prior three-month period, multi-unit permits are down 11.3%. For single-unit housing the numbers for starts and permits have been roughly flat on a quarter to quarter basis.
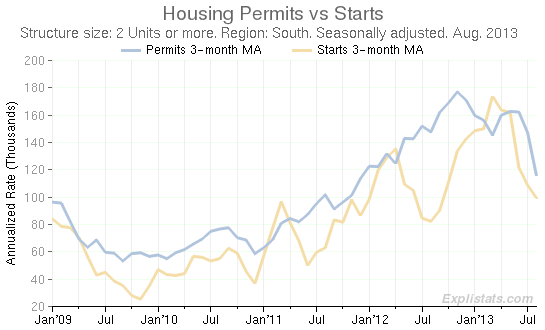
Over the past year or so, the real driver of multi-unit activity has been the South region. But this has reversed over the past few months. (See charts immediately below).

Click to enlarge
Note, incidentally, what seems to be a residual seasonality in the adjusted number for the South region.

Click to enlarge
Note the recent uptick in Northeast permits.
