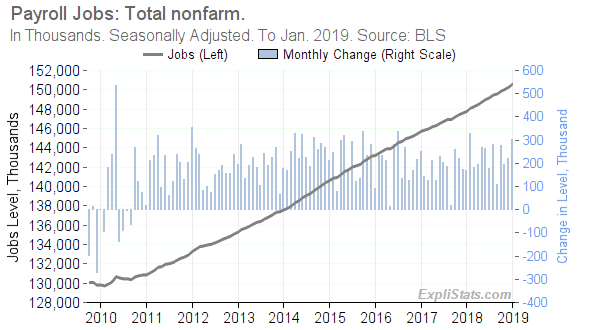
For more charts and tables at finer levels of detail, please visit our Payrolls Dataset Page.

Click to enlarge
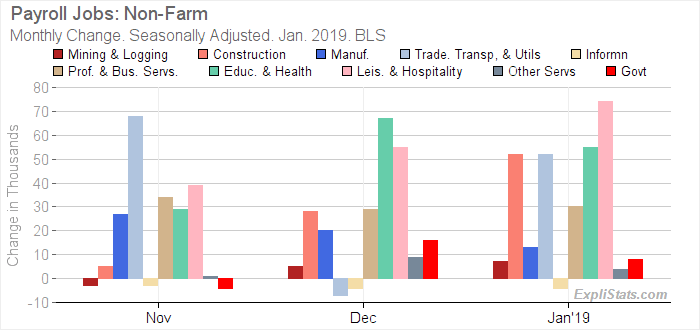
Gains across the major employment sectors are shown in the bar-chart and table below.

Click to enlarge
| U.S. Payroll Jobs: Total Nonfarm. Seasonally Adjusted. | |||||||||
|---|---|---|---|---|---|---|---|---|---|
| Sector | Level (000s) | Monthly Change (000s) | Mthly Chg (%) | Yr/Yr Change (000s)* | Yr/Yr Chg (%)* | ||||
| Jan. 2019 | Nov. 2018 | Dec. 2018 | Jan. 2019 | Jan. 2019 | Nov. 2018 | Dec. 2018 | Jan. 2019 | Jan. 2019 | |
| Total nonfarm | 150,574 | 196.0 | 222.0 | 304.0 | 0.20 | 2,626.0 | 2,674.0 | 2,807.0 | 1.90 |
| – Total private | 128,068 | 200.0 | 206.0 | 296.0 | 0.23 | 2,526.0 | 2,565.0 | 2,675.0 | 2.13 |
| – – Mining and logging | 760 | -3.0 | 5.0 | 7.0 | 0.93 | 56.0 | 61.0 | 61.0 | 8.73 |
| – – Construction | 7,464 | 5.0 | 28.0 | 52.0 | 0.70 | 324.0 | 319.0 | 338.0 | 4.74 |
| – – Manufacturing | 12,822 | 27.0 | 20.0 | 13.0 | 0.10 | 272.0 | 264.0 | 261.0 | 2.08 |
| – – Trade, transportation, and utilities | 27,828 | 68.0 | -7.0 | 52.0 | 0.19 | 301.0 | 292.0 | 326.0 | 1.19 |
| – – Information | 2,821 | -3.0 | -4.0 | -4.0 | -0.14 | 14.0 | 4.0 | 9.0 | 0.32 |
| – – Financial activities | 8,631 | 3.0 | 4.0 | 13.0 | 0.15 | 121.0 | 118.0 | 129.0 | 1.52 |
| – – Professional and business services | 21,276 | 34.0 | 29.0 | 30.0 | 0.14 | 555.0 | 553.0 | 546.0 | 2.63 |
| – – Education and health services | 23,967 | 29.0 | 67.0 | 55.0 | 0.23 | 490.0 | 532.0 | 522.0 | 2.23 |
| – – Leisure and hospitality | 16,618 | 39.0 | 55.0 | 74.0 | 0.45 | 326.0 | 349.0 | 410.0 | 2.53 |
| – – Other services | 5,881 | 1.0 | 9.0 | 4.0 | 0.07 | 67.0 | 73.0 | 73.0 | 1.26 |
| – – Government | 22,506 | -4.0 | 16.0 | 8.0 | 0.04 | 100.0 | 109.0 | 132.0 | 0.59 |
This article was generated automatically from our database. We can automate custom reports, spreadsheets and data feeds for our clients. Please contact us with your requirements.
