For more charts and tables at finer levels of detail, please visit our Payrolls Dataset Page.
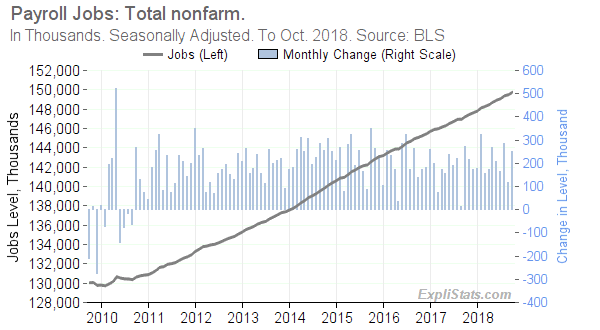
Click to enlarge
Gains across the major employment sectors are shown in the bar-chart and table below.
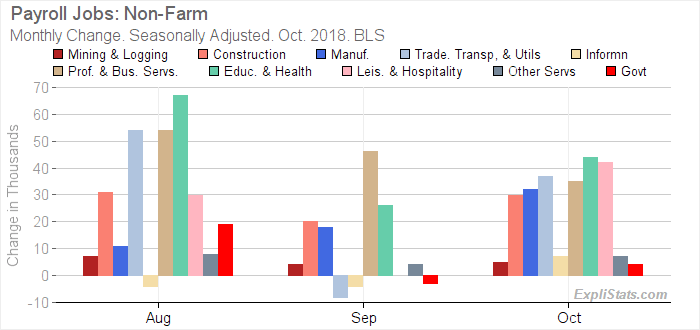
Click to enlarge
| U.S. Payroll Jobs: Total Nonfarm. Seasonally Adjusted. | |||||||||
|---|---|---|---|---|---|---|---|---|---|
| Sector | Level (000s) | Monthly Change (000s) | Mthly Chg (%) | Yr/Yr Change (000s)* | Yr/Yr Chg (%)* | ||||
| Oct. 2018 | Aug. 2018 | Sep. 2018 | Oct. 2018 | Oct. 2018 | Aug. 2018 | Sep. 2018 | Oct. 2018 | Oct. 2018 | |
| Total Nonfarm | 149,750 | 286.0 | 118.0 | 250.0 | 0.17 | 2,433.0 | 2,537.0 | 2,516.0 | 1.71 |
| – Total Private | 127,353 | 267.0 | 121.0 | 246.0 | 0.19 | 2,376.0 | 2,481.0 | 2,450.0 | 1.96 |
| – – Mining and Logging | 756 | 7.0 | 4.0 | 5.0 | 0.67 | 57.0 | 61.0 | 65.0 | 9.41 |
| – – Construction | 7,318 | 31.0 | 20.0 | 30.0 | 0.41 | 306.0 | 317.0 | 330.0 | 4.72 |
| – – Manufacturing | 12,785 | 11.0 | 18.0 | 32.0 | 0.25 | 272.0 | 284.0 | 296.0 | 2.37 |
| – – Trade, Transportation, and Utilities | 27,865 | 54.0 | -8.0 | 37.0 | 0.13 | 346.0 | 303.0 | 312.0 | 1.13 |
| – – Information | 2,769 | -4.0 | -4.0 | 7.0 | 0.25 | -26.0 | -22.0 | -15.0 | -0.54 |
| – – Financial Activities | 8,609 | 9.0 | 15.0 | 7.0 | 0.08 | 110.0 | 117.0 | 115.0 | 1.35 |
| – – Professional and Business Services | 21,146 | 54.0 | 46.0 | 35.0 | 0.17 | 522.0 | 541.0 | 516.0 | 2.50 |
| – – Education and Health Services | 23,811 | 67.0 | 26.0 | 44.0 | 0.19 | 458.0 | 470.0 | 499.0 | 2.14 |
| – – Leisure and Hospitality | 16,410 | 30.0 | 0.0 | 42.0 | 0.26 | 247.0 | 322.0 | 254.0 | 1.57 |
| – – Other Services | 5,884 | 8.0 | 4.0 | 7.0 | 0.12 | 84.0 | 88.0 | 78.0 | 1.34 |
| – Government | 22,397 | 19.0 | -3.0 | 4.0 | 0.02 | 57.0 | 56.0 | 66.0 | 0.30 |
This article was generated automatically from our database. We can automate custom reports, spreadsheets and data feeds for our clients. Please contact us with your requirements.