For more charts and tables at finer levels of detail, please visit our Payrolls Dataset Page.
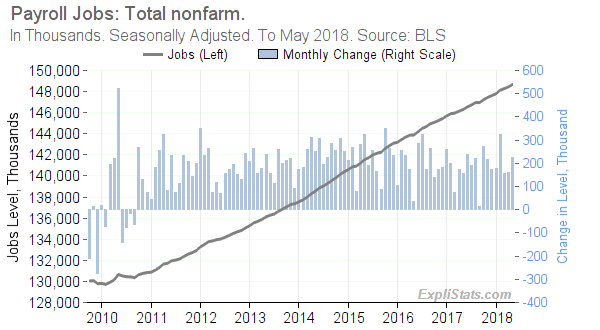
Click to enlarge
Gains across the major employment sectors are shown in the bar-chart and table below.
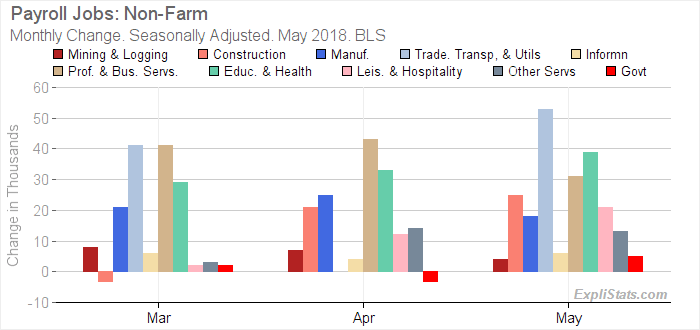
Click to enlarge
| U.S. Payroll Jobs: Total Nonfarm. Seasonally Adjusted. | |||||||||
|---|---|---|---|---|---|---|---|---|---|
| Sector | Level (000s) | Monthly Change (000s) | Mthly Chg (%) | Yr/Yr Change (000s)* | Yr/Yr Chg (%)* | ||||
| May 2018 | Mar. 2018 | Apr. 2018 | May 2018 | May 2018 | Mar. 2018 | Apr. 2018 | May 2018 | May 2018 | |
| Total Nonfarm | 148,662 | 155.0 | 159.0 | 223.0 | 0.15 | 2,311.0 | 2,295.0 | 2,363.0 | 1.62 |
| – Total Private | 126,336 | 153.0 | 162.0 | 218.0 | 0.17 | 2,301.0 | 2,289.0 | 2,342.0 | 1.89 |
| – – Mining and Logging | 733 | 8.0 | 7.0 | 4.0 | 0.55 | 62.0 | 58.0 | 58.0 | 8.59 |
| – – Construction | 7,210 | -3.0 | 21.0 | 25.0 | 0.35 | 242.0 | 268.0 | 286.0 | 4.13 |
| – – Manufacturing | 12,673 | 21.0 | 25.0 | 18.0 | 0.14 | 230.0 | 245.0 | 259.0 | 2.09 |
| – – Trade, Transportation, and Utilities | 27,789 | 41.0 | 0.0 | 53.0 | 0.19 | 309.0 | 305.0 | 350.0 | 1.28 |
| – – Information | 2,775 | 6.0 | 4.0 | 6.0 | 0.22 | -44.0 | -29.0 | -19.0 | -0.68 |
| – – Financial Activities | 8,559 | 5.0 | 3.0 | 8.0 | 0.09 | 138.0 | 128.0 | 125.0 | 1.48 |
| – – Professional and Business Services | 20,891 | 41.0 | 43.0 | 31.0 | 0.15 | 516.0 | 509.0 | 483.0 | 2.37 |
| – – Education and Health Services | 23,563 | 29.0 | 33.0 | 39.0 | 0.17 | 451.0 | 438.0 | 441.0 | 1.91 |
| – – Leisure and Hospitality | 16,281 | 2.0 | 12.0 | 21.0 | 0.13 | 304.0 | 267.0 | 262.0 | 1.64 |
| – – Other Services | 5,862 | 3.0 | 14.0 | 13.0 | 0.22 | 93.0 | 100.0 | 97.0 | 1.68 |
| – Government | 22,326 | 2.0 | -3.0 | 5.0 | 0.02 | 10.0 | 6.0 | 21.0 | 0.09 |
This article was generated automatically from our database. We can automate custom reports, spreadsheets and data feeds for our clients. Please contact us with your requirements.