For more charts and tables at finer levels of detail, please visit our Payrolls Dataset Page.
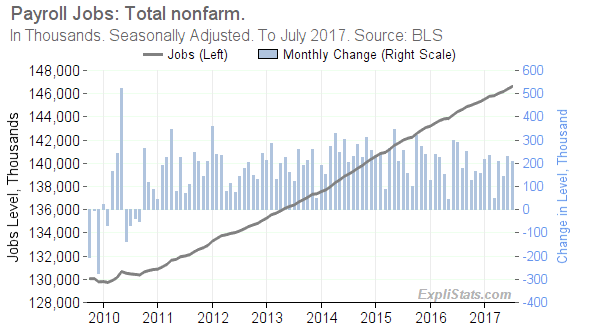
Click to enlarge
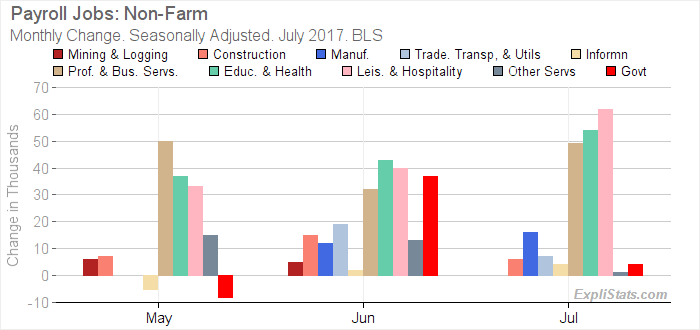
Gains across the major employment sectors are shown in the bar-chart and table below.
Click to enlarge
| U.S. Payroll Jobs: Total Nonfarm. Seasonally Adjusted. | |||||||||
|---|---|---|---|---|---|---|---|---|---|
| Sector | Level (000s) | Monthly Change (000s) | Mthly Chg (%) | Yr/Yr Change (000s)* | Yr/Yr Chg (%)* | ||||
| July 2017 | May 2017 | June 2017 | July 2017 | July 2017 | May 2017 | June 2017 | July 2017 | July 2017 | |
| Total Nonfarm | 146,615 | 145.0 | 231.0 | 209.0 | 0.14 | 2,306.0 | 2,240.0 | 2,158.0 | 1.49 |
| – Total Private | 124,257 | 153.0 | 194.0 | 205.0 | 0.17 | 2,176.0 | 2,101.0 | 2,057.0 | 1.68 |
| – – Mining and Logging | 712 | 6.0 | 5.0 | 0.0 | 0.00 | 33.0 | 44.0 | 48.0 | 7.23 |
| – – Construction | 6,899 | 7.0 | 15.0 | 6.0 | 0.09 | 188.0 | 203.0 | 191.0 | 2.85 |
| – – Manufacturing | 12,425 | 0.0 | 12.0 | 16.0 | 0.13 | 62.0 | 62.0 | 66.0 | 0.53 |
| – – Trade, Transportation, and Utilities | 27,388 | 0.0 | 19.0 | 7.0 | 0.03 | 175.0 | 172.0 | 143.0 | 0.52 |
| – – Information | 2,730 | -5.0 | 2.0 | 4.0 | 0.15 | -15.0 | -54.0 | -48.0 | -1.73 |
| – – Financial Activities | 8,448 | 10.0 | 13.0 | 6.0 | 0.07 | 166.0 | 162.0 | 148.0 | 1.78 |
| – – Professional and Business Services | 20,745 | 50.0 | 32.0 | 49.0 | 0.24 | 642.0 | 615.0 | 580.0 | 2.88 |
| – – Education and Health Services | 23,151 | 37.0 | 43.0 | 54.0 | 0.23 | 510.0 | 494.0 | 507.0 | 2.24 |
| – – Leisure and Hospitality | 15,998 | 33.0 | 40.0 | 62.0 | 0.39 | 335.0 | 326.0 | 346.0 | 2.21 |
| – – Other Services | 5,761 | 15.0 | 13.0 | 1.0 | 0.02 | 80.0 | 77.0 | 76.0 | 1.34 |
| – Government | 22,358 | -8.0 | 37.0 | 4.0 | 0.02 | 130.0 | 139.0 | 101.0 | 0.45 |
This article was generated automatically from our database. We can automate custom reports, spreadsheets and data feeds for our clients. Please contact us with your requirements.