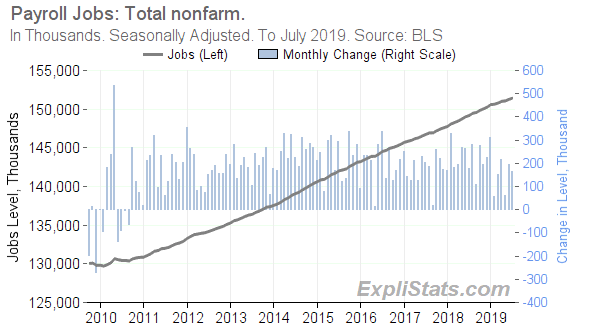
For more charts and tables at finer levels of detail, please visit our Payrolls Dataset Page.

Click to enlarge
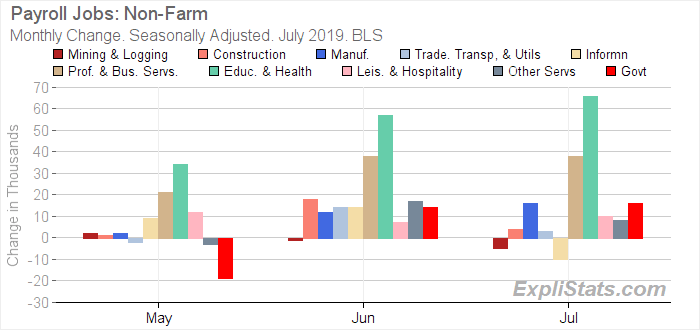
Gains across the major employment sectors are shown in the bar-chart and table below.

Click to enlarge
| U.S. Payroll Jobs: Total Nonfarm. Seasonally Adjusted. | |||||||||
|---|---|---|---|---|---|---|---|---|---|
| Sector | Level (000s) | Monthly Change (000s) | Mthly Chg (%) | Yr/Yr Change (000s)* | Yr/Yr Chg (%)* | ||||
| July 2019 | May 2019 | June 2019 | July 2019 | July 2019 | May 2019 | June 2019 | July 2019 | July 2019 | |
| Total nonfarm | 151,431 | 62.0 | 193.0 | 164.0 | 0.11 | 2,329.0 | 2,260.0 | 2,246.0 | 1.51 |
| – Total private | 128,889 | 81.0 | 179.0 | 148.0 | 0.11 | 2,244.0 | 2,187.0 | 2,162.0 | 1.71 |
| – – Mining and logging | 752 | 2.0 | -1.0 | -5.0 | -0.66 | 30.0 | 22.0 | 18.0 | 2.45 |
| – – Construction | 7,505 | 1.0 | 18.0 | 4.0 | 0.05 | 216.0 | 217.0 | 202.0 | 2.77 |
| – – Manufacturing | 12,864 | 2.0 | 12.0 | 16.0 | 0.12 | 181.0 | 161.0 | 157.0 | 1.24 |
| – – Trade, transportation, and utilities | 27,824 | -2.0 | 14.0 | 3.0 | 0.01 | 177.0 | 199.0 | 181.0 | 0.65 |
| – – Information | 2,819 | 9.0 | 14.0 | -10.0 | -0.35 | -16.0 | -2.0 | -13.0 | -0.46 |
| – – Financial activities | 8,677 | 5.0 | 3.0 | 18.0 | 0.21 | 100.0 | 92.0 | 105.0 | 1.22 |
| – – Professional and business services | 21,484 | 21.0 | 38.0 | 38.0 | 0.18 | 479.0 | 466.0 | 467.0 | 2.22 |
| – – Education and health services | 24,299 | 34.0 | 57.0 | 66.0 | 0.27 | 595.0 | 587.0 | 605.0 | 2.55 |
| – – Leisure and hospitality | 16,716 | 12.0 | 7.0 | 10.0 | 0.06 | 399.0 | 363.0 | 338.0 | 2.06 |
| – – Other services | 5,949 | -3.0 | 17.0 | 8.0 | 0.13 | 83.0 | 82.0 | 102.0 | 1.74 |
| – – Government | 22,542 | -19.0 | 14.0 | 16.0 | 0.07 | 85.0 | 73.0 | 84.0 | 0.37 |
This article was generated automatically from our database. We can automate custom reports, spreadsheets and data feeds for our clients. Please contact us with your requirements.
