Something strange seems to be happening in the Payrolls Survey wage estimates for a sub-sector of the Retail industry. More investigation is needed before we can say what implications this might have for next month’s hourly wage headline number.
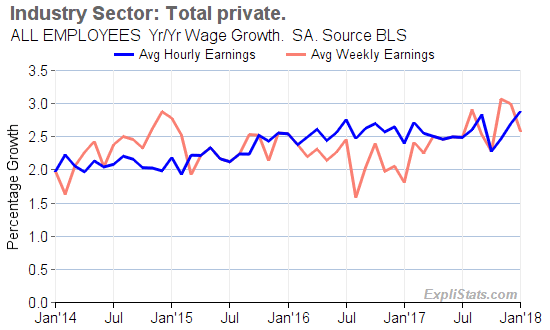
Many commentators made claims for inflationary pressures in the release of January’s Payroll Survey. This was despite the less-noticed fall in weekly earnings. The focus was on the hourly wage number year/year gain of 2.9% which beat December’s year/year number due to a large jump in average wage in the most recent month, January.

The BLS models both “All Employees” and that subset of employees termed “Production & Non Supervisory”. The remaining employees, which we will refer to as “Supervisory” are not modeled explicitly, nor reported by the BLS.
Although a “Suprevisory” series represents the difference of two estimates, and thus may suffer a large variable error term, we here at ExpliStats have derived the various Supervisory series and taken a look.
Average Hourly Wage Increases by Industry Sector and Employee Type (Seasonally Adjusted)
(Hover over a dot to see more data)
Note that:
- Production workers in total averaged an hourly wage gain of only 0.13% (large pink dot), whereas the headline number for All Employees was 0.34% (not shown in the chart above).
- At the same time, Supervisory employees enjoyed an average gain of 1.36% (large, light-blue dot.)
- The high average gain for Supervisors included a very large average gain of 6.42% for the 2.3 million Retail sector Supervisory workers.
Doing some further math, we estimate that:
- The rise in Retail Supervisors’ hourly wage accounts for about 0.10% of the reported total 0.34% rise in January.
- Professional & Business Services, Supervisory wage growth contributed 0.09% (of which 0.02% was due to an increase in number of employees, rather than an increase in their average wage.)
- Education & Heath Services, Production employee wage growth contributed 0.06%.
General merchandise stores
The Retail sector is itself composed of sub-sectors, but these are reported only in non-seasonally adjusted form, and one month later. One of these sub-sectors, “General Merchandise Stores” seems to be stretching the BLS’s estimation methods.
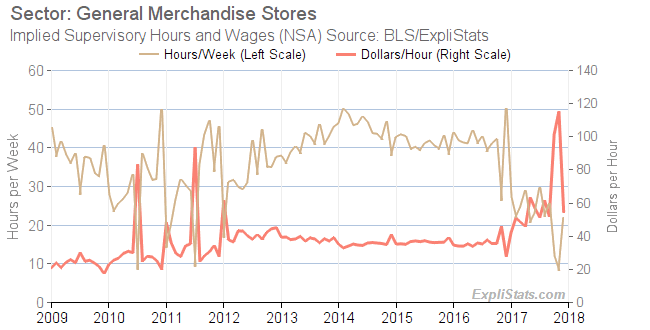
Whereas weekly earnings are fairly stable, it appears that the separate estimation of hours worked for All Employees and for Production Employees are varying in a manner which leads to the hours attributable to non-Production (Supervisory) employees being unrealistic.
This in turn leads to unrealistic average hourly wages for Supervisory workers in this sub-sector. After a stable period of 40+ hour weeks for $35+ per hour, 2017 has seen 20 hour weeks at $110+ per hour. (See chart below).
This has a significant impact on the headline average hourly wage number.

We will not have January 2018 data until the February Payrolls survey is published (March 9th) but we expect to see a large up-tick in the hourly wage for this sub-sector in January, as the main driver of the seasonally adjusted gain for the Retail sector as a whole.
We need to understand more about this situation before we can say whether mean-reversion is due for February. We plan to make this the subject of a forthcoming article.
