ExpliStats Trend Estimates for July 2014
Click to enlarge
Click to enlarge
The Bureau of Labor Statistics will publish the results of their Payroll Employment Survey for July 2014 in ten days’ time on Friday, August 1st
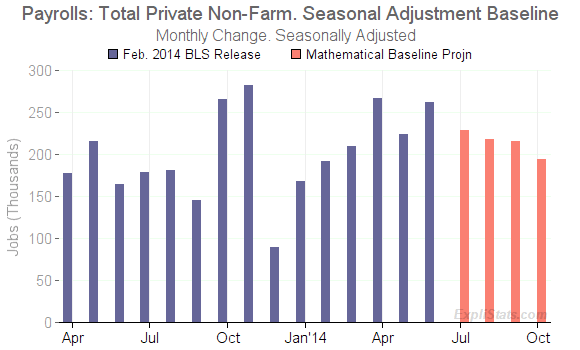
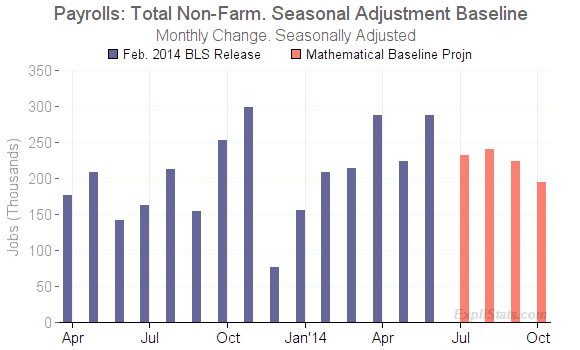
Here are the mathematical trend numbers which are produced in advance by the ExpliStats modeling of the BLS seasonal adjustment process. The trends here are what could be expected for July, given the seasonally-adjusted BLS trends established through June.
For July 2014:
Click to enlarge
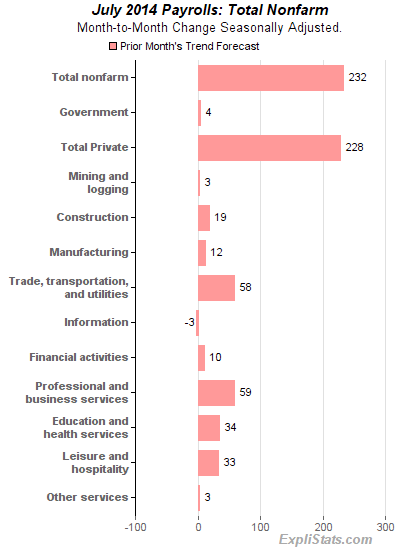
Total Non-Farm Payrolls to gain 232,000 jobs
Private Non-Farm Payrolls to gain 228,000 jobs
The bar charts above show these projections (orange) for the next four months, alongside the published BLS numbers to date. (Total and Private are shown in separate charts.)
The bar chart on the right breaks out these numbers in to the various component industries.
Often, the eventual consensus outlook is close to the trend, but the consensus keeps changing up to the point of the new data release; the trend, however, is set based as of the prior month’s release. Even with the late revisions to the Consensus, though, the Trend Model has proved a better predictor of the headline payroll changes.
Review of ExpliStats Trend Estimates for June 2014
Click to enlarge
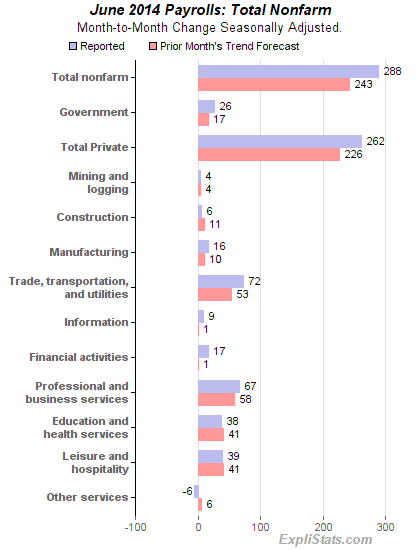
Significant over-trend sectors were:
Government, where Federal jobs increased by 2,000 according to the BLS Survey (all at the US Postal Service) whereas the trend numbers called for a reduction of 4,000. There were also two large offsetting differences in Local Government between educational and non-educational jobs. It is unclear what happened here, although the timing of the end of the school year within mid-June can cause large seasonal adjustment problems.
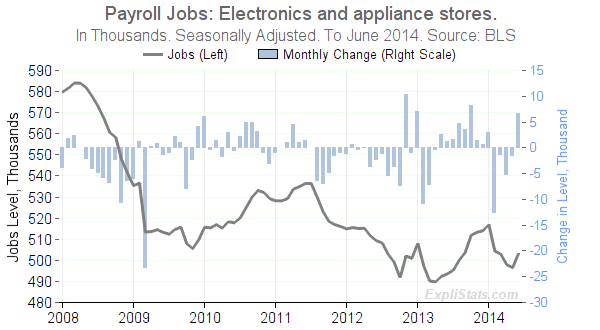
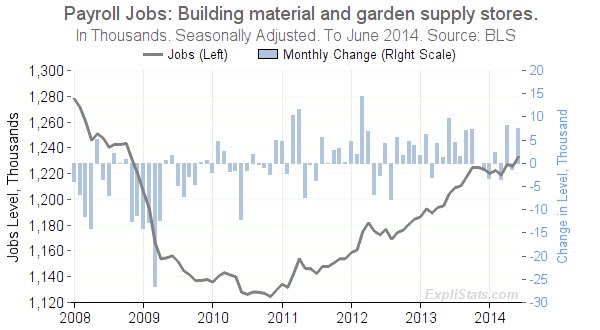
Trade, Transportation & Utilities where two Retail Trade subsectors: Electronics & Appliance Stores, and Building & Garden Supplies Stores saw a combined increase of 14,300 jobs, against a trend increase of only 200 jobs. Both of these sub-sectors have historically exhibited high volatility. (See charts below.)
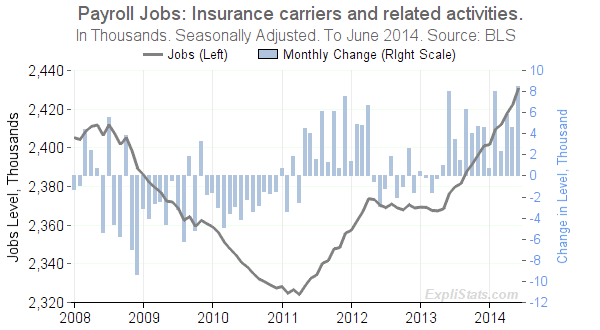
Fiancial Services. Insurance Carriers jobs rose by 8,500 according to the BLS, with the trend calling for just under 1000. Growth has been strong but choppy in this sub-sector over the past twelve months. (See chart below.) Other over-trend contributors in this sector were Real Estate related and Credit Intermediaries.
And, within Professional & Business Services, the sub-sector of Professional & Technical Services came in with a BLS estimate of 30,000 more jobs as opposed to the trend number of 20,000. This sub-sector includes legal, accounting, design, consulting services, and because the BLS does not publish full underlying data for the prior month, it is a difficult sub-sector for us to have confidence in calculating the trend.
Charts mentioned above:
Click to enlarge
Click to enlarge
Click to enlarge
