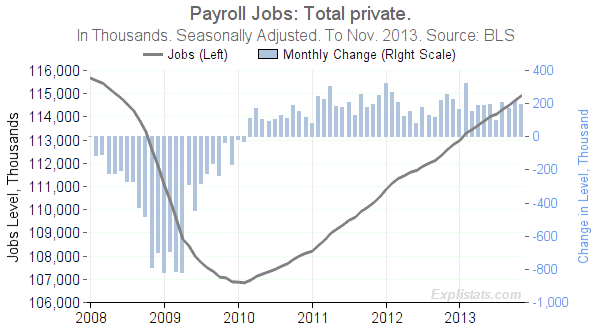
Click to enlarge
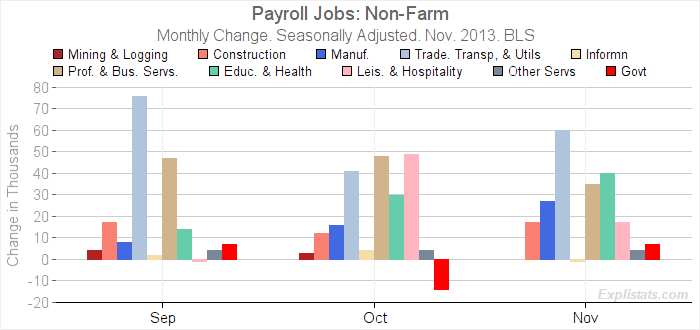
Gains across the major employment sectors are shown in the bar-chart and table below.
For more charts and tables at finer levels of detail, please visit our Payrolls Dataset Page.

Click to enlarge
| U.S. Payroll Jobs: Total Nonfarm. Seasonally Adjusted. |
|||||||||
|---|---|---|---|---|---|---|---|---|---|
| Sector | Level (000s) | Monthly Change (000s) | Mthly Chg (%) | Yr/Yr Change (000s)* | Yr/Yr Chg (%)* | ||||
| Nov. 2013 |
Sep. 2013 |
Oct. 2013 |
Nov. 2013 |
Nov. 2013 |
Sep. 2013 |
Oct. 2013 |
Nov. 2013 |
Nov. 2013 |
|
| Total Nonfarm | 136,765 | 175.0 | 200.0 | 203.0 | 0.15 | 2,297.0 | 2,337.0 | 2,293.0 | 1.71 |
| – Total Private | 114,908 | 168.0 | 214.0 | 196.0 | 0.17 | 2,378.0 | 2,375.0 | 2,315.0 | 2.06 |
| – – Mining and Logging | 884 | 4.0 | 3.0 | 0.0 | 0.00 | 34.0 | 43.0 | 31.0 | 3.63 |
| – – Construction | 5,851 | 17.0 | 12.0 | 17.0 | 0.29 | 189.0 | 185.0 | 178.0 | 3.14 |
| – – Manufacturing | 12,014 | 8.0 | 16.0 | 27.0 | 0.23 | 46.0 | 56.0 | 76.0 | 0.64 |
| – – Trade, Transportation, and Utilities | 26,202 | 76.0 | 41.0 | 60.0 | 0.23 | 551.0 | 519.0 | 482.0 | 1.87 |
| – – Information | 2,684 | 2.0 | 4.0 | -1.0 | -0.04 | 11.0 | 14.0 | -1.0 | -0.04 |
| – – Financial Activities | 7,905 | -3.0 | 7.0 | -3.0 | -0.04 | 95.0 | 91.0 | 83.0 | 1.06 |
| – – Professional and Business Services | 18,760 | 47.0 | 48.0 | 35.0 | 0.19 | 668.0 | 663.0 | 643.0 | 3.55 |
| – – Education and Health Services | 20,826 | 14.0 | 30.0 | 40.0 | 0.19 | 344.0 | 340.0 | 366.0 | 1.79 |
| – – Leisure and Hospitality | 14,283 | -1.0 | 49.0 | 17.0 | 0.12 | 399.0 | 426.0 | 422.0 | 3.04 |
| – – Other Services | 5,499 | 4.0 | 4.0 | 4.0 | 0.07 | 41.0 | 38.0 | 35.0 | 0.64 |
| – Government | 21,857 | 7.0 | -14.0 | 7.0 | 0.03 | -81.0 | -38.0 | -22.0 | -0.10 |
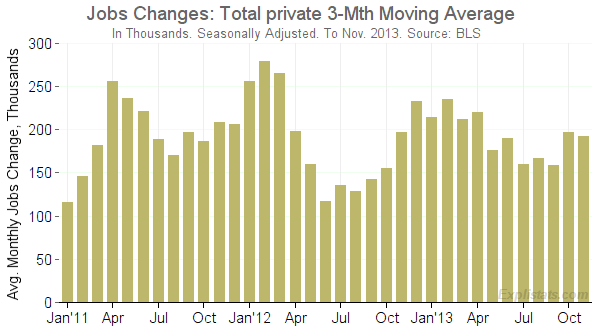
Smoothed Growth

Click to enlarge
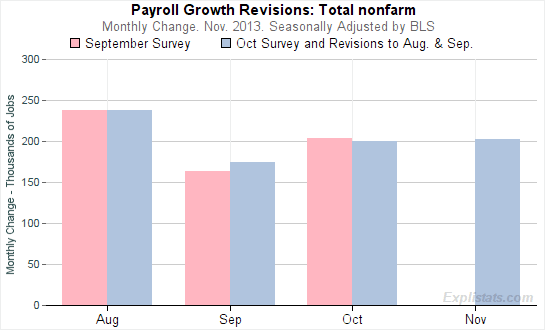
Revision to Total Growth in Prior Months
Minimal revisions to prior months at the top level. Note, however, that the September and August numbers, published by the BLS, are misleading: The November survey has, in fact, modified all prior month numbers. But the BLS chooses not to report this.

Click to enlarge
